Prometheus High Availability with Thanos in Kubernetes
Prometheus is a popular monitoring and alerting tool in the Kubernetes ecosystem. Nevertheless, with the expansion of your infrastructure, a single Prometheus instance may encounter difficulties handling the growing workload and potentially become a vulnerable single point of failure.

In this blog post, we will explore how to configure Prometheus for high availability using Thanos in Kubernetes. Additionally, we will leverage Helm for easy deployment and management.
If you're not familiar with Prometheus, we recommend going through their documentation first.
What is Thanos?
To successfully implement Thanos, it's crucial to comprehend the integral components of this robust tool and its seamless integration.
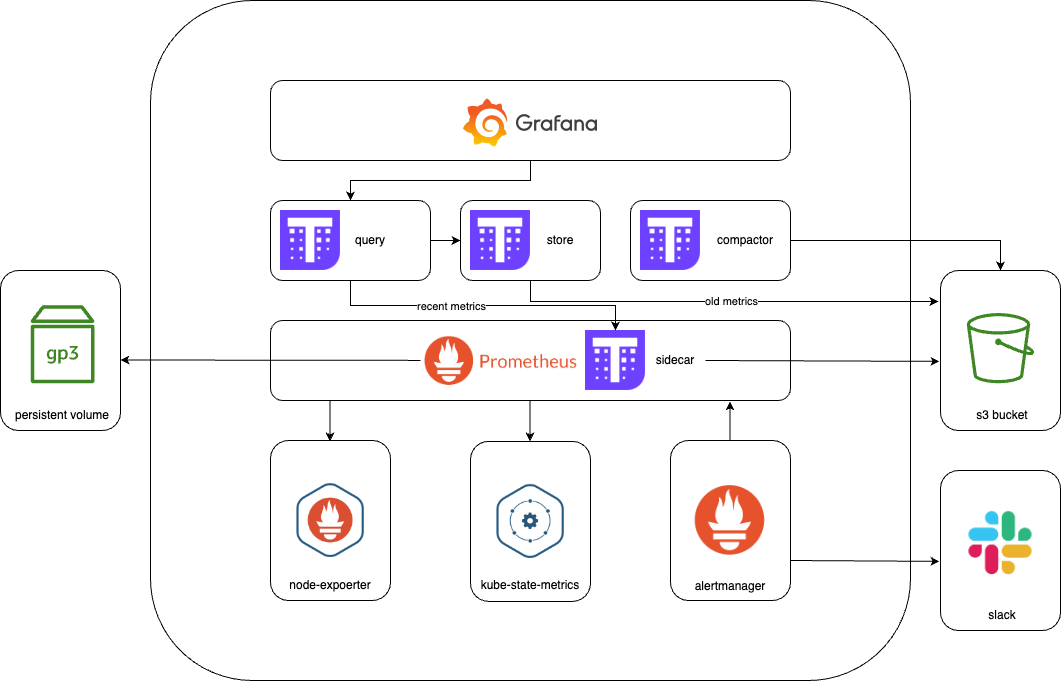
Thanos is an open-source project that enhances Prometheus' functionalities and offers a scalable, highly available, and long-term storage solution. It allows you to achieve horizontal scalability while maintaining a global querying view and deduplication across multiple Prometheus instances. Thanos acts as a middle layer between Prometheus and a long-term storage system like object storage or a distributed database. In the diagram [1] below, you can see how all the components work together.
Now that we have a global understanding of what Thanos is, let's look at each component in detail.
Thanos Sidecar
The Thanos sidecar works hand in hand with each Prometheus instance. It collects data blocks from Prometheus and stores them in an object storage or distributed database. Additionally, the sidecar pushes data blocks received from Prometheus into the storage system.
Thanos Query
The Thanos querier facilitates querying across data stored in various Prometheus instances and the object storage or distributed database. It serves as a central endpoint, gathering query results from different sources and providing a global view of the data. With Thanos Querier, there's no need to query individual Prometheus instances; instead, you can consolidate and deduplicate responses from store gateways and the object storage system.
Thanos Store
Thanos Store Gateway acts as an API Gateway between your Thanos cluster and the Object store. Its primary role is to proxy read requests made by Thanos Query to the underlying store. By doing so, it provides consistent global querying across multiple Prometheus instances. Instead of querying individual Prometheus instances directly, the store gateway offers a unified view of data from all instances, simplifying the querying process.
Thanos Compactor
The Thanos compactor is responsible for optimizing the long-term storage system by performing downsampling, deduplication, and compaction of data blocks. It periodically scans the blocks stored in the object storage or distributed database and applies these operations to enhance storage efficiency and reduce query response times.
Integrate Thanos with Prometheus
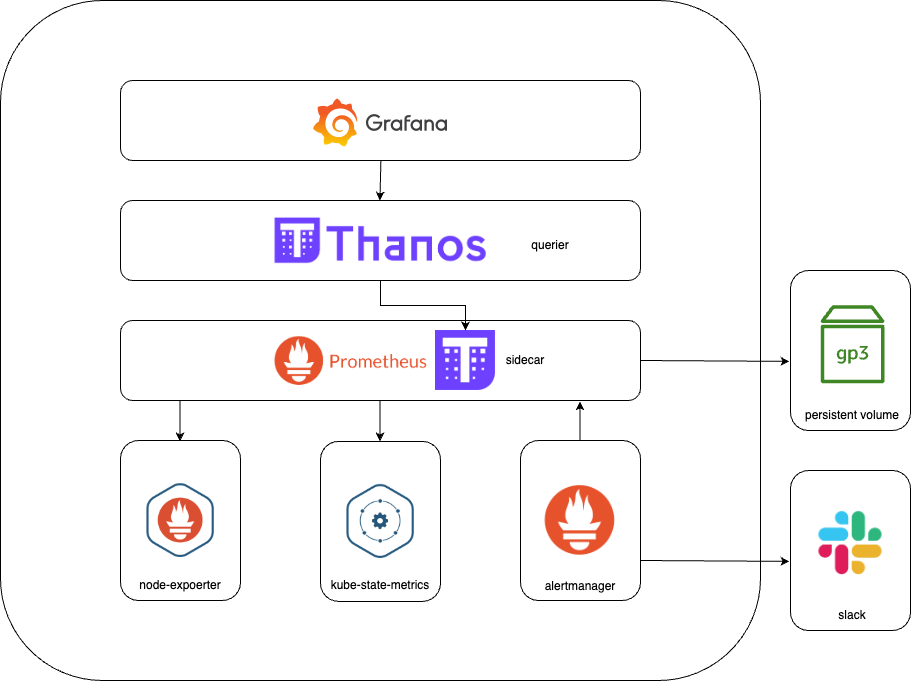
As we've seen, Thanos consists of different components, but we will only configure the sidecar and query components. Our decision to emphasize these two components is rooted in our goal of prioritizing high availability over extensive long-term storage solutions. The diagram [2] below shows how the components work together with Prometheus.
Before proceeding, make sure you have the following in place.
- Kubernetes cluster: Set up a Kubernetes cluster where you plan to deploy Prometheus and Thanos.
- Prometheus: Have a Prometheus setup ready, including the necessary configuration files.
Note: Our Prometheus Component is deployed using the Prometheus Operator. The Thanos sidecar is integrated with the Prometheus CRD, which is very useful for the management of both components. Deploying components such as the Querier, Compactor, and Store Gateway of Thanos should be done separately from the Prometheus Operator. The kube-Thanos project provides useful starting points for deploying these additional Thanos components.
1. Prometheus Custom Resource with Thanos Sidecar
The Prometheus Custom Resource Definition (CRD) offers the capability to include a Thanos sidecar in the Prometheus Pod. Enabling the sidecar requires setting a value in the Thanos section. For instance, a straightforward configuration option is to specify a valid container image version for the Thanos sidecar.
...
spec:
  ...
  thanos:
    version: v0.31.0
...
After making this adjustment, a new Prometheus Pod will be started with the Thanos sidecar container. As of now, it is desired to modify the number of replicas to have multiple instances of Prometheus running in the cluster.
In order to enable our Thanos Query instance to discover and query the Thanos sidecars, it's essential to include a service that exposes the ports of the Thanos sidecar.
---
apiVersion: v1
kind: Service
metadata:
  name: prometheus-thanos-discovery
  namespace: prometheus
  labels:
    app: prometheus-thanos-discovery
    app.kubernetes.io/part-of: prometheus
spec:
  type: ClusterIP
  clusterIP: None
  ports:
    - name: grpc
      port: 10901
      targetPort: grpc
    - name: http
      port: 10902
      targetPort: http
  selector:
    app.kubernetes.io/name: prometheus
    operator.prometheus.io/name: prometheus-prometheus
2. Thanos Query in our cluster
After configuring the Sidecar for all Prometheus instances, the next step involves le veraging Thanos's global Query Layer for executing PromQL queries simultaneously across all instances.
The Querier component of Thanos is designed to be stateless and horizontally scalable, allowing for deployment with multiple replicas. Once connected to the Thanos Sidecar, it automatically identifies the relevant Prometheus servers to contact for a given PromQL query.
Additionally, the Thanos Querier implements Prometheus's official HTTP API, enabling its compatibility with external tools like Grafana. It also provides a modified version of Prometheus's user interface, allowing for ad-hoc querying and monitoring of the Thanos stores' status.
Let's start by deploying the Kubernetes Thanos-query ServiceAccount.
---
apiVersion: v1
kind: ServiceAccount
metadata:
  name: thanos-query
  namespace: prometheus
  labels:
    app.kubernetes.io/component: query-layer
    app.kubernetes.io/instance: thanos-query
    app.kubernetes.io/name: thanos-query
    app.kubernetes.io/version: v0.31.0
Next, let's deploy the Thanos-query service.
---
apiVersion: v1
kind: Service
metadata:
  labels:
    app.kubernetes.io/component: query-layer
    app.kubernetes.io/instance: thanos-query
    app.kubernetes.io/name: thanos-query
    app.kubernetes.io/version: v0.31.0
  name: thanos-query
  namespace: prometheus
spec:
  ports:
    - name: grpc
      port: 10901
      targetPort: grpc
    - name: http
      port: 9090
      targetPort: http
  selector:
    app.kubernetes.io/component: query-layer
    app.kubernetes.io/instance: thanos-query
    app.kubernetes.io/name: thanos-query
Now, The most crucial step lies ahead: deploying the Thanos Query application.
Note:
- The container argument --endpoint=dnssrv+_grpc._tcp.prometheus-thanos-discovery.prometheus.svc.cluster.local helps detect Thanos API servers through respective DNS lookups. Don't forget to adjust the service url to match your setup.
- The container argument --query.replica-label=replica labels that will be treated as a replica indicator along which data is deduplicated.
---
apiVersion: apps/v1
kind: Deployment
metadata:
  labels:
    app.kubernetes.io/component: query-layer
    app.kubernetes.io/instance: thanos-query
    app.kubernetes.io/name: thanos-query
    app.kubernetes.io/version: v0.31.0
  name: thanos-query
  namespace: prometheus
spec:
  replicas: 1
  selector:
    matchLabels:
      app.kubernetes.io/component: query-layer
      app.kubernetes.io/instance: thanos-query
      app.kubernetes.io/name: thanos-query
  template:
    metadata:
      labels:
        app.kubernetes.io/component: query-layer
        app.kubernetes.io/instance: thanos-query
        app.kubernetes.io/name: thanos-query
        app.kubernetes.io/version: v0.31.0
    spec:
      affinity:
        podAntiAffinity:
          preferredDuringSchedulingIgnoredDuringExecution:
            - podAffinityTerm:
                labelSelector:
                  matchExpressions:
                    - key: app.kubernetes.io/name
                      operator: In
                      values:
                        - thanos-query
                namespaces:
                  - prometheus
                topologyKey: kubernetes.io/hostname
              weight: 100
      serviceAccountName: thanos-query
      containers:
        - name: thanos-query
          image: "quay.io/thanos/thanos:v0.31.0"
          args:
            - query
            - --log.level=info
            - --grpc-address=0.0.0.0:10901
            - --http-address=0.0.0.0:9090
            - --query.replica-label=replica
            - --endpoint=dnssrv+_grpc._tcp.prometheus-thanos-discovery.prometheus.svc.cluster.local
          ports:
            - name: grpc
              containerPort: 10901
            - name: http
              containerPort: 9090
          livenessProbe:
            failureThreshold: 4
            httpGet:
              path: /-/healthy
              port: 9090
              scheme: HTTP
            periodSeconds: 30
          readinessProbe:
            failureThreshold: 20
            httpGet:
              path: /-/ready
              port: 9090
              scheme: HTTP
            periodSeconds: 5
          terminationMessagePolicy: FallbackToLogsOnError
          resources:
            requests:
              memory: 1.5Gi
            limits:
              memory: 1.5Gi
      terminationGracePeriodSeconds: 120
With all the essential components successfully operating in our cluster, we can now proceed to validate the functionality of querying metrics using the Thanos query. This can be achieved by port-forwarding to a pod.
# Get the thanos query pods
kubectl -n <namespace> get pods

# Port forward to a pod
kubectl -n <namespace> port-forward <pod-name> <local-port>:<remote-port>
By navigating to the Stores section in the Thanos Gui [3] we can validate whether all Prometheus instances have been found by the Thanos Query application.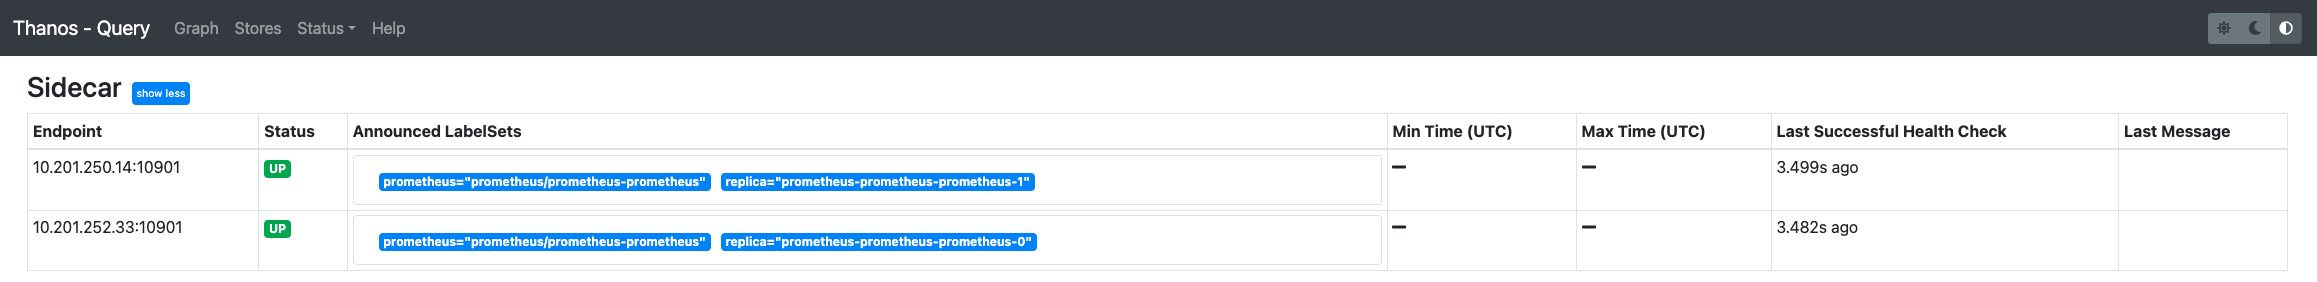
In the Graph section [4], we can validate whether deduplication works by running a query with this function enabled and/or disabled.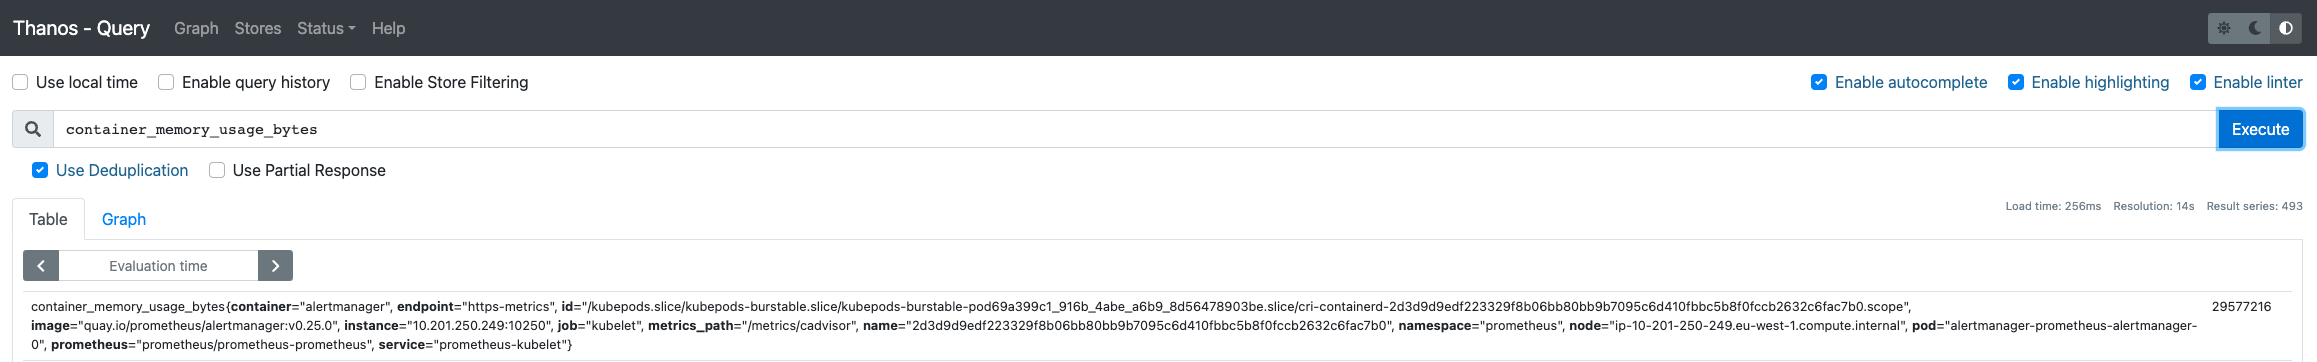
With confirmation that our Thanos configuration is functioning properly, the final step involves configuring Grafana to utilize Thanos Query as the endpoint for metrics.
Conclusion
Configuring Prometheus for high availability is crucial to maintain uninterrupted monitoring and seamless data collection. The open-source project, Thanos, offers a solution for achieving scalability and long-term data storage. In this blog post, we've guided you through the process of configuring Prometheus with Thanos in Kubernetes using the Prometheus Operator, allowing you to seamlessly deploy and manage Thanos for your Prometheus setup.
For more information, visit the official Thanos Documentation.