


How to monitor your Kubernetes cluster with Datadog
Over the past few months, Kubernetes has become a more mature product and setting up a cluster has become a lot easier. Especially with the official release of Amazon Elastic Container Service for Kubernetes (EKS) on Amazon Web Services, another major cloud provider is able to provide a Kubernetes cluster with a few clicks.
While the complexity of creating a Kubernetes cluster has decreased drastically, there still are some challenging tasks when setting up the resources within the cluster. The biggest challenge for us has always been providing reliable monitoring and logging for the components within the cluster. Since we’ve migrated to Datadog, things have changed for the better. In this blog post, we’ll teach you how to monitor your Kubernetes cluster with Datadog.
Setting up Datadog monitoring and logging
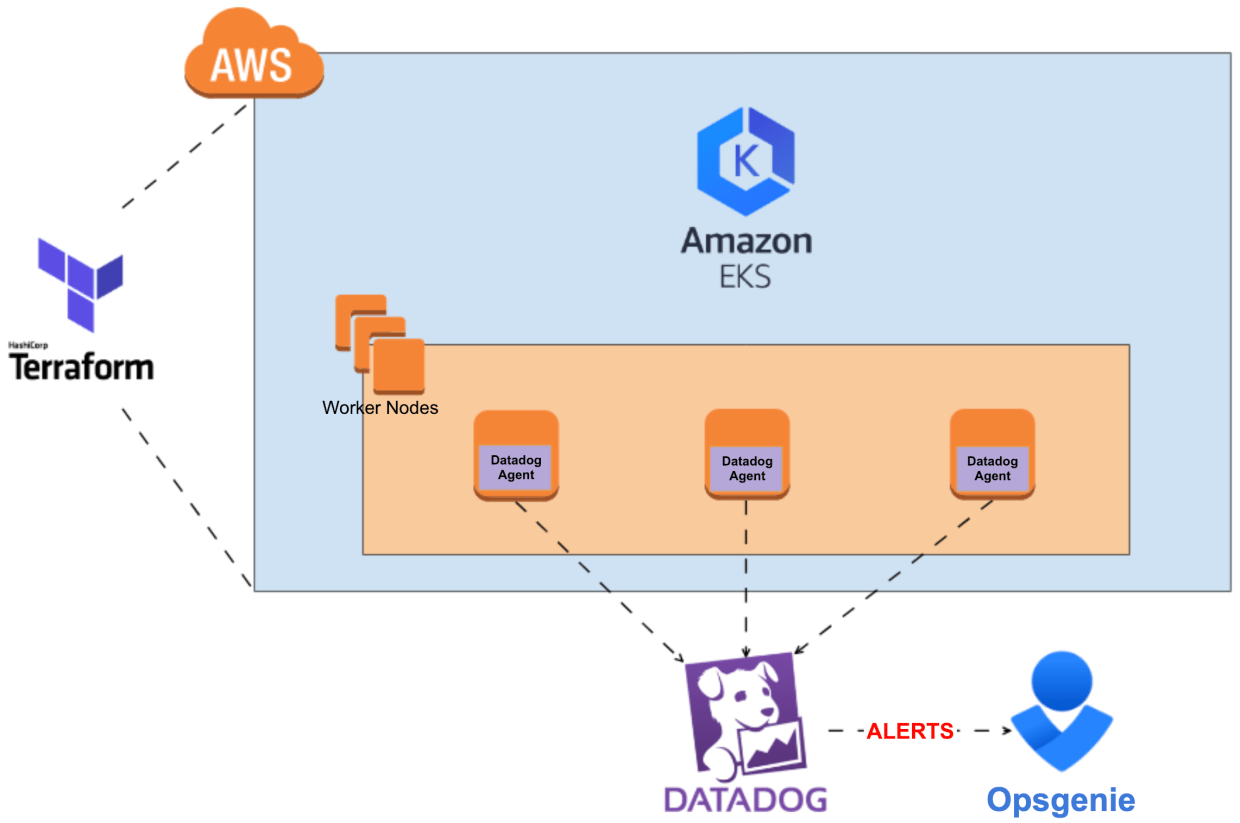
For this blog post, we’ll assume you have an active Kubernetes setup and kubectl configured. Our cloud services team prefers the following Kubernetes setup:
- Amazon Web Services (AWS) as the cloud provider
- Amazon Elastic Container Service for Kubernetes (EKS) which offers managed Kubernetes
- Terraform to automate the process of creating the required resources within the AWS account
- VPC and networking requirements
- EKS cluster
- Kubernetes worker nodes
- Datadog for monitoring and log collection
- and OpsGenie for alert and incident management.
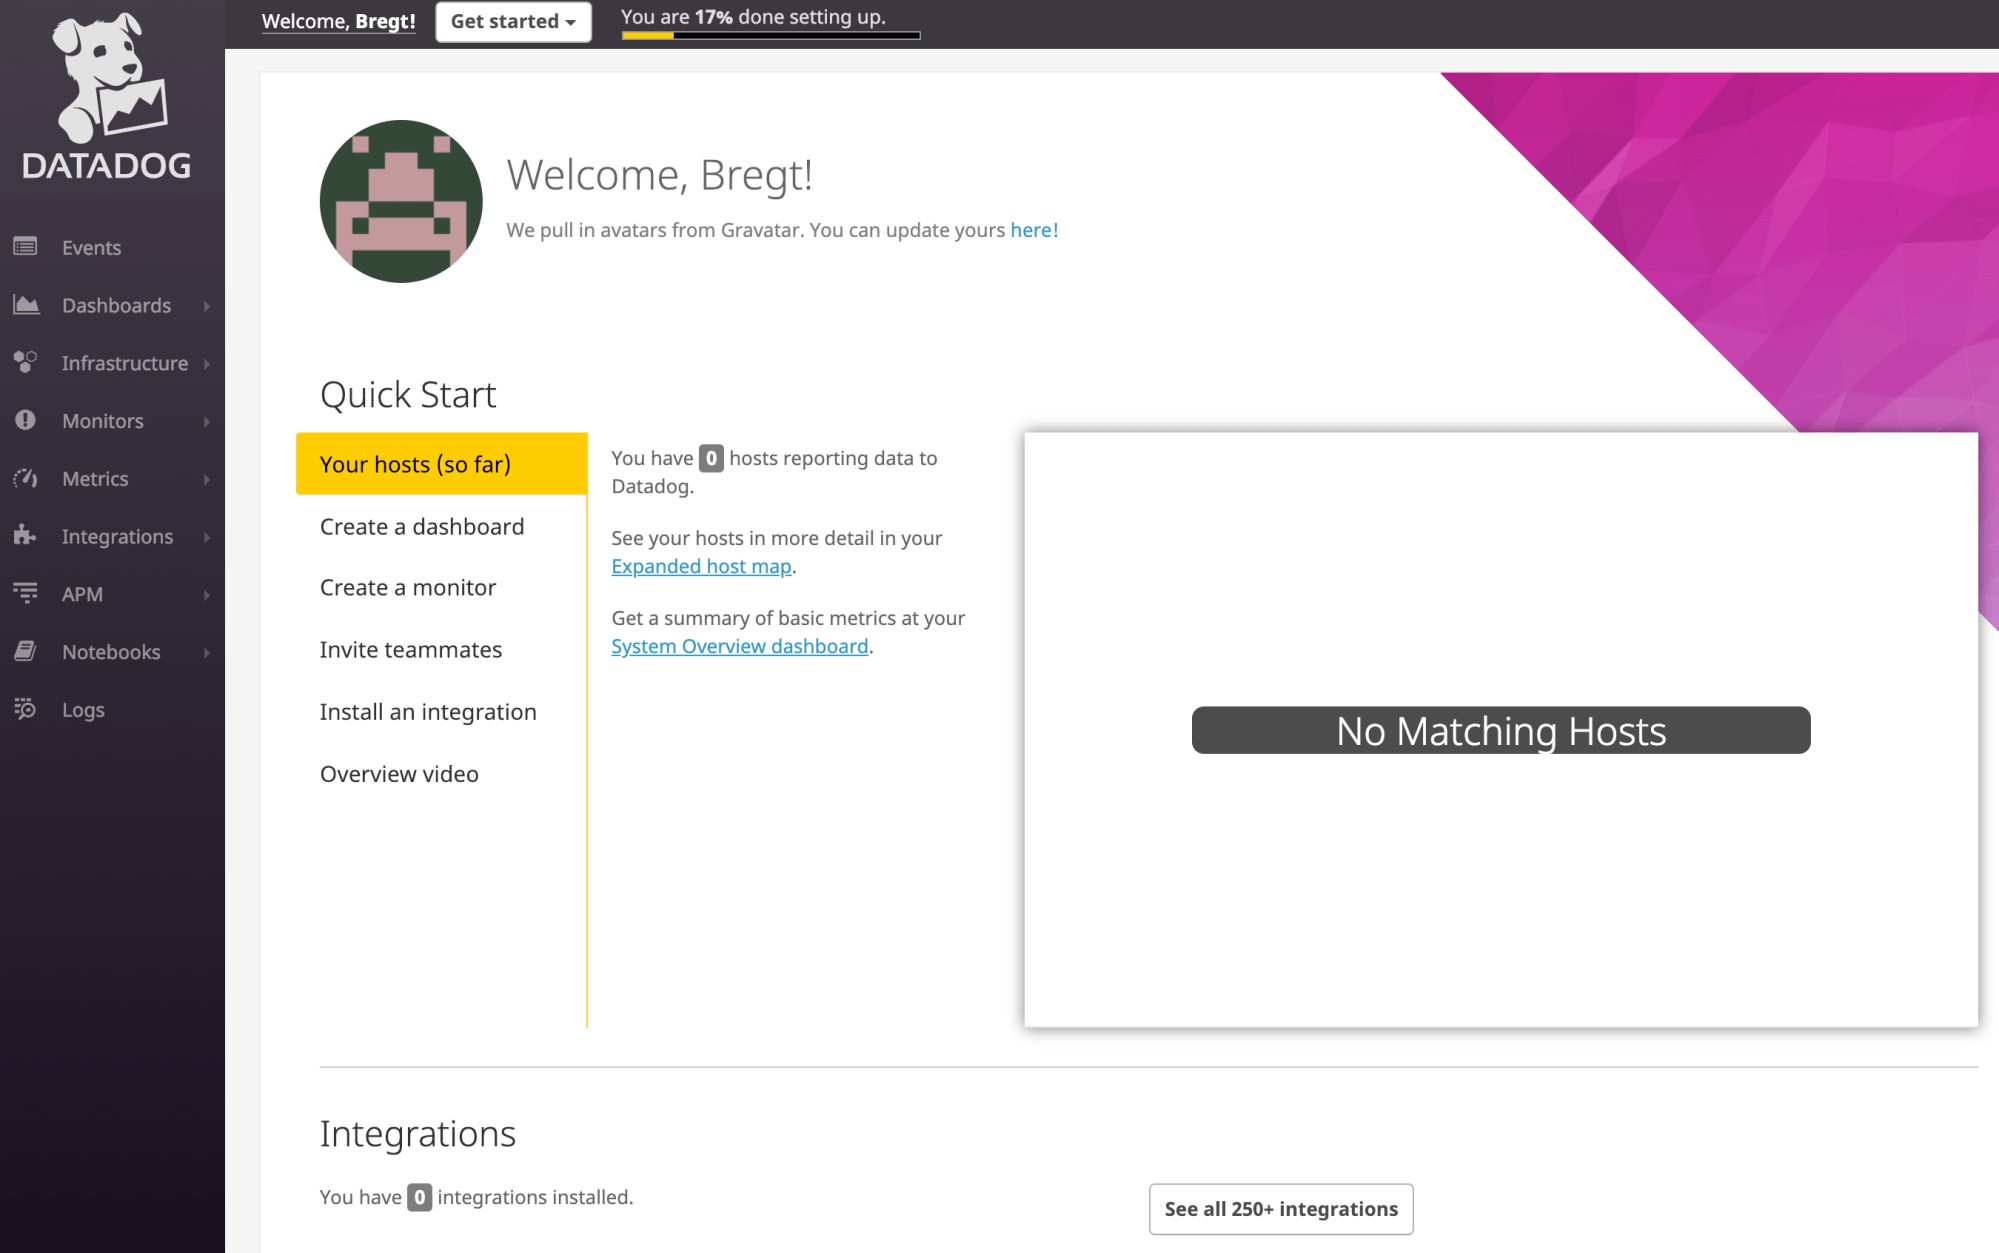
Of course, you’re free to choose your own tools. One requirement, however, is that you must use Datadog (else this whole blog post won’t make a lot of sense). If you’re new to Datadog, you need to create a Datadog account. You can try it out for 14 days for free by clicking here and pressing the “Get started” button. Complete the form and login to your newly created organization. Time to add some hosts!
Kubernetes DaemonSet for creating Datadog agents
A Kubernetes DaemonSet makes sure that a Docker container running the Datadog agent is created on every worker node (host) that has joined the Kubernetes cluster. This way, you can monitor the resources for all active worker nodes within the cluster. The YAML file specifies the configuration for all Datadog components we want to enable:
If you wonder what the file looks like, this is it:
apiVersion: apps/v1
kind: DaemonSet
metadata:
  name: datadog-agent
  namespace: tools
  labels:
    k8s-app: datadog-agent
spec:
  selector:
    matchLabels:
      name: datadog-agent
  template:
    metadata:
      labels:
        name: datadog-agent
    spec:
      #tolerations:
      #- key: node-role.kubernetes.io/master
      #  operator: Exists
      #  effect: NoSchedule
      serviceAccountName: datadog-agent
      containers:
      - image: datadog/agent:latest-jmx
        imagePullPolicy: Always
        name: datadog-agent
        ports:
        - containerPort: 8125
          # hostPort: 8125
          name: dogstatsdport
          protocol: UDP
        - containerPort: 8126
          # hostPort: 8126
          name: traceport
          protocol: TCP
        env:
        - name: DD_API_KEY
          valueFrom:
            secretKeyRef:
              name: datadog
              key: DATADOG_API_KEY
        - name: DD_COLLECT_KUBERNETES_EVENTS
          value: "true"
        - name: DD_LEADER_ELECTION
          value: "true"
        - name: KUBERNETES
          value: "yes"
        - name: DD_PROCESS_AGENT_ENABLED
          value: "true"
        - name: DD_LOGS_ENABLED
          value: "true"
        - name: DD_LOGS_CONFIG_CONTAINER_COLLECT_ALL
          value: "true"
        - name: SD_BACKEND
          value: "docker"
        - name: SD_JMX_ENABLE
          value: "yes"
        - name: DD_KUBERNETES_KUBELET_HOST
          valueFrom:
            fieldRef:
              fieldPath: status.hostIP
        resources:
          requests:
            memory: "400Mi"
            cpu: "200m"
          limits:
            memory: "400Mi"
            cpu: "200m"
        volumeMounts:
        - name: dockersocket
          mountPath: /var/run/docker.sock
        - name: procdir
          mountPath: /host/proc
          readOnly: true
        - name: sys-fs
          mountPath: /host/sys
          readOnly: true
        - name: root-fs
          mountPath: /rootfs
          readOnly: true
        - name: cgroups
          mountPath: /host/sys/fs/cgroup
          readOnly: true
        - name: pointerdir
          mountPath: /opt/datadog-agent/run
        - name: dd-agent-config
          mountPath: /conf.d
        - name: datadog-yaml
          mountPath: /etc/datadog-agent/datadog.yaml
          subPath: datadog.yaml
        livenessProbe:
          exec:
            command:
            - ./probe.sh
          initialDelaySeconds: 60
          periodSeconds: 5
          failureThreshold: 3
          successThreshold: 1
          timeoutSeconds: 3
      volumes:
      - hostPath:
          path: /var/run/docker.sock
        name: dockersocket
      - hostPath:
          path: /proc
        name: procdir
      - hostPath:
          path: /sys/fs/cgroup
        name: cgroups
      - hostPath:
          path: /opt/datadog-agent/run
        name: pointerdir
      - name: sys-fs
        hostPath:
          path: /sys
      - name: root-fs
        hostPath:
          path: /
      - name: datadog-yaml
        configMap:
          name: dd-agent-config
          items:
          - key: datadog-yaml
path: datadog.yaml#tolerations:
#- key: node-role.Kubernetes.io/master
# operator: Exists
# effect: NoScheduleSince we use EKS, the master plane is maintained by AWS. Therefore we don’t want any Datadog agent pods to run on the master nodes. Uncomment this if you want to monitor your master nodes, for example when you are running Kops.
containers:
- image: Datadog/agent:latest-JMX
  imagePullPolicy: Always
  name: Datadog-agent
We use the JMX-enabled version of the Datadog agent image, which is required for Kafka and Zookeeper integrations. If you don’t need JMX, you should use Datadog/agent:latest as this image is less resource-intensive.
We specify “imagePullPolicy: Always” so we are sure that on startup, the image labelled “latest” is pulled again. In other cases when a new “latest” release is available, it won’t get pulled as we already have an image tagged “latest” available on the node.
env:
- name: DD_API_KEY
  valueFrom:
    secretKeyRef:
      name: Datadog
      key: Datadog_API_KEY
We use SealedSecrets, which stores the Datadog API Key. It also sets the environment variable to the value of the Secret. If you don’t know how to get an API Key from Datadog, you can do that here. Enter a useful name and press the “Create API” button.
- name: DD_LOGS_ENABLED
  value: "true"
This ensures the Datadog logs agent is enabled.
- name: SD_BACKEND
  value: "Docker"
- name: SD_JMX_ENABLE
  value: "yes"
This enables autodiscovery and JMX, which we need for our Zookeeper and Kafka integration to work, as it will use JMX to collect data. For more information on autodiscovery, you can read the Datadog docs here.
resources:
  requests:
    memory: "400Mi"
    cpu: "200m"
  limits:
    memory: "400Mi"
    cpu: "200m"
After enabling JMX, the memory usage of the container drastically increases. If you are not using the JMX version of the image, half of these limits should be fine.
        - name: Datadog-yaml
          mountPath: /etc/Datadog-agent/Datadog.yaml
          subPath: Datadog.yaml
…
      - name: Datadog-yaml
        configMap:
          name: dd-agent-config
          items:
          - key: Datadog-yaml
            path: Datadog.yaml
To add some custom configuration, we need to override the default Datadog.yaml configuration file. The ConfigMap has the following content:
apiVersion: v1
kind: ConfigMap
metadata:
  name: datadogtoken
  namespace: tools
data:
  event.tokenKey: "0"
---
apiVersion: v1
kind: ConfigMap
metadata:
  name: dd-agent-config
  namespace: tools
data:
  datadog-yaml: |-
    check_runners: 1
    listeners:
      - name: kubelet
    config_providers:
      - name: kubelet
        polling: true
    tags: tst, kubelet, kubernetes, worker, env:tst, environment:tst, application:kubernetes, location:aws
The first ConfigMap called Datadogtoken is required to have a persistent state when a new leader is elected. The content of the dd-agent-config ConfigMap is used to create the Datadog.yaml configuration file. We specify and add some extra tags to the resources collected by the agent, which is useful to create filters later on.
livenessProbe:
  exec:
    command:
    - ./probe.sh
  initialDelaySeconds: 60
  periodSeconds: 5
  failureThreshold: 3
  successThreshold: 1
  timeoutSeconds: 3
When having a Kubernetes cluster with a lot of nodes, we’ve seen containers being stuck in a CrashLoopBackOff status. It’s therefore a good idea to do a more advanced health check to see whether your containers have actually booted. Make sure the health checks start polling after 60 minutes, which seems to be the best value.
Once you have gathered all required configuration in your ConfigMap and DaemonSet files, you can create the resources using your Kubernetes CLI.
kubectl create -f ConfigMap.yaml
kubectl create -f DaemonSet.yaml
After a few seconds, you should start seeing logs and metrics in the Datadog GUI.
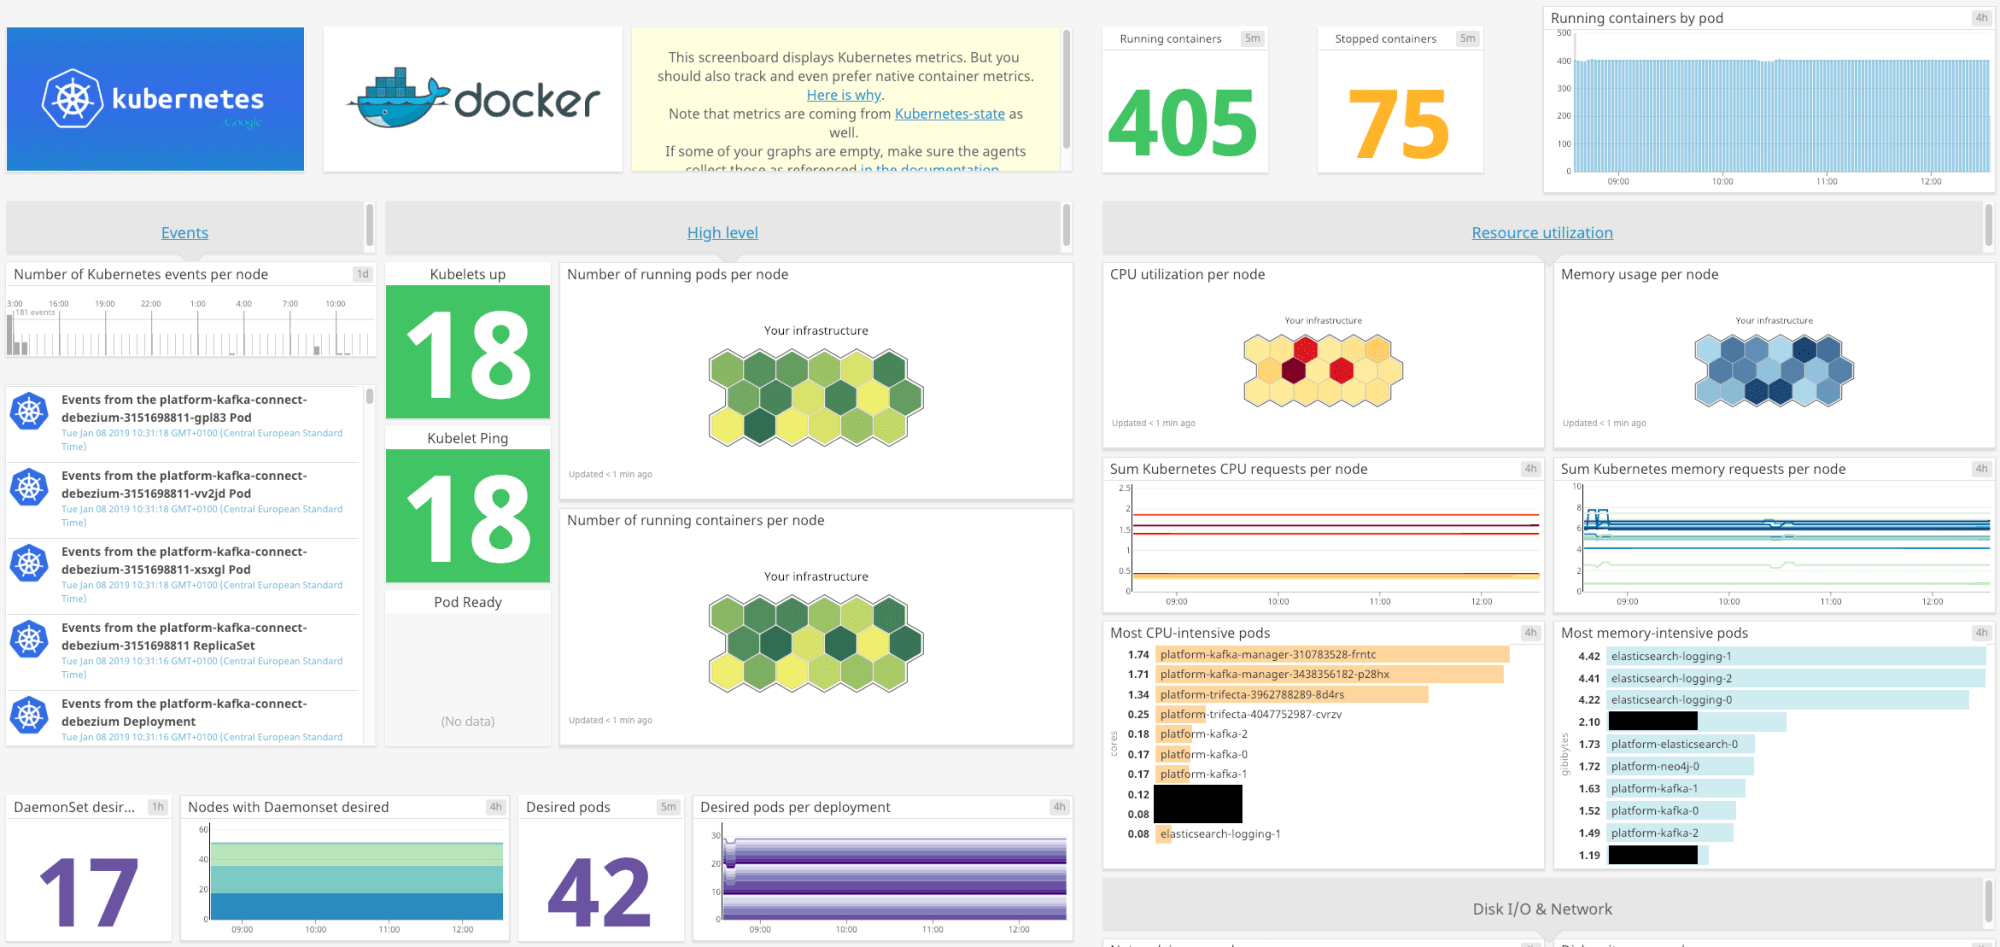
Taking a look at the collected data
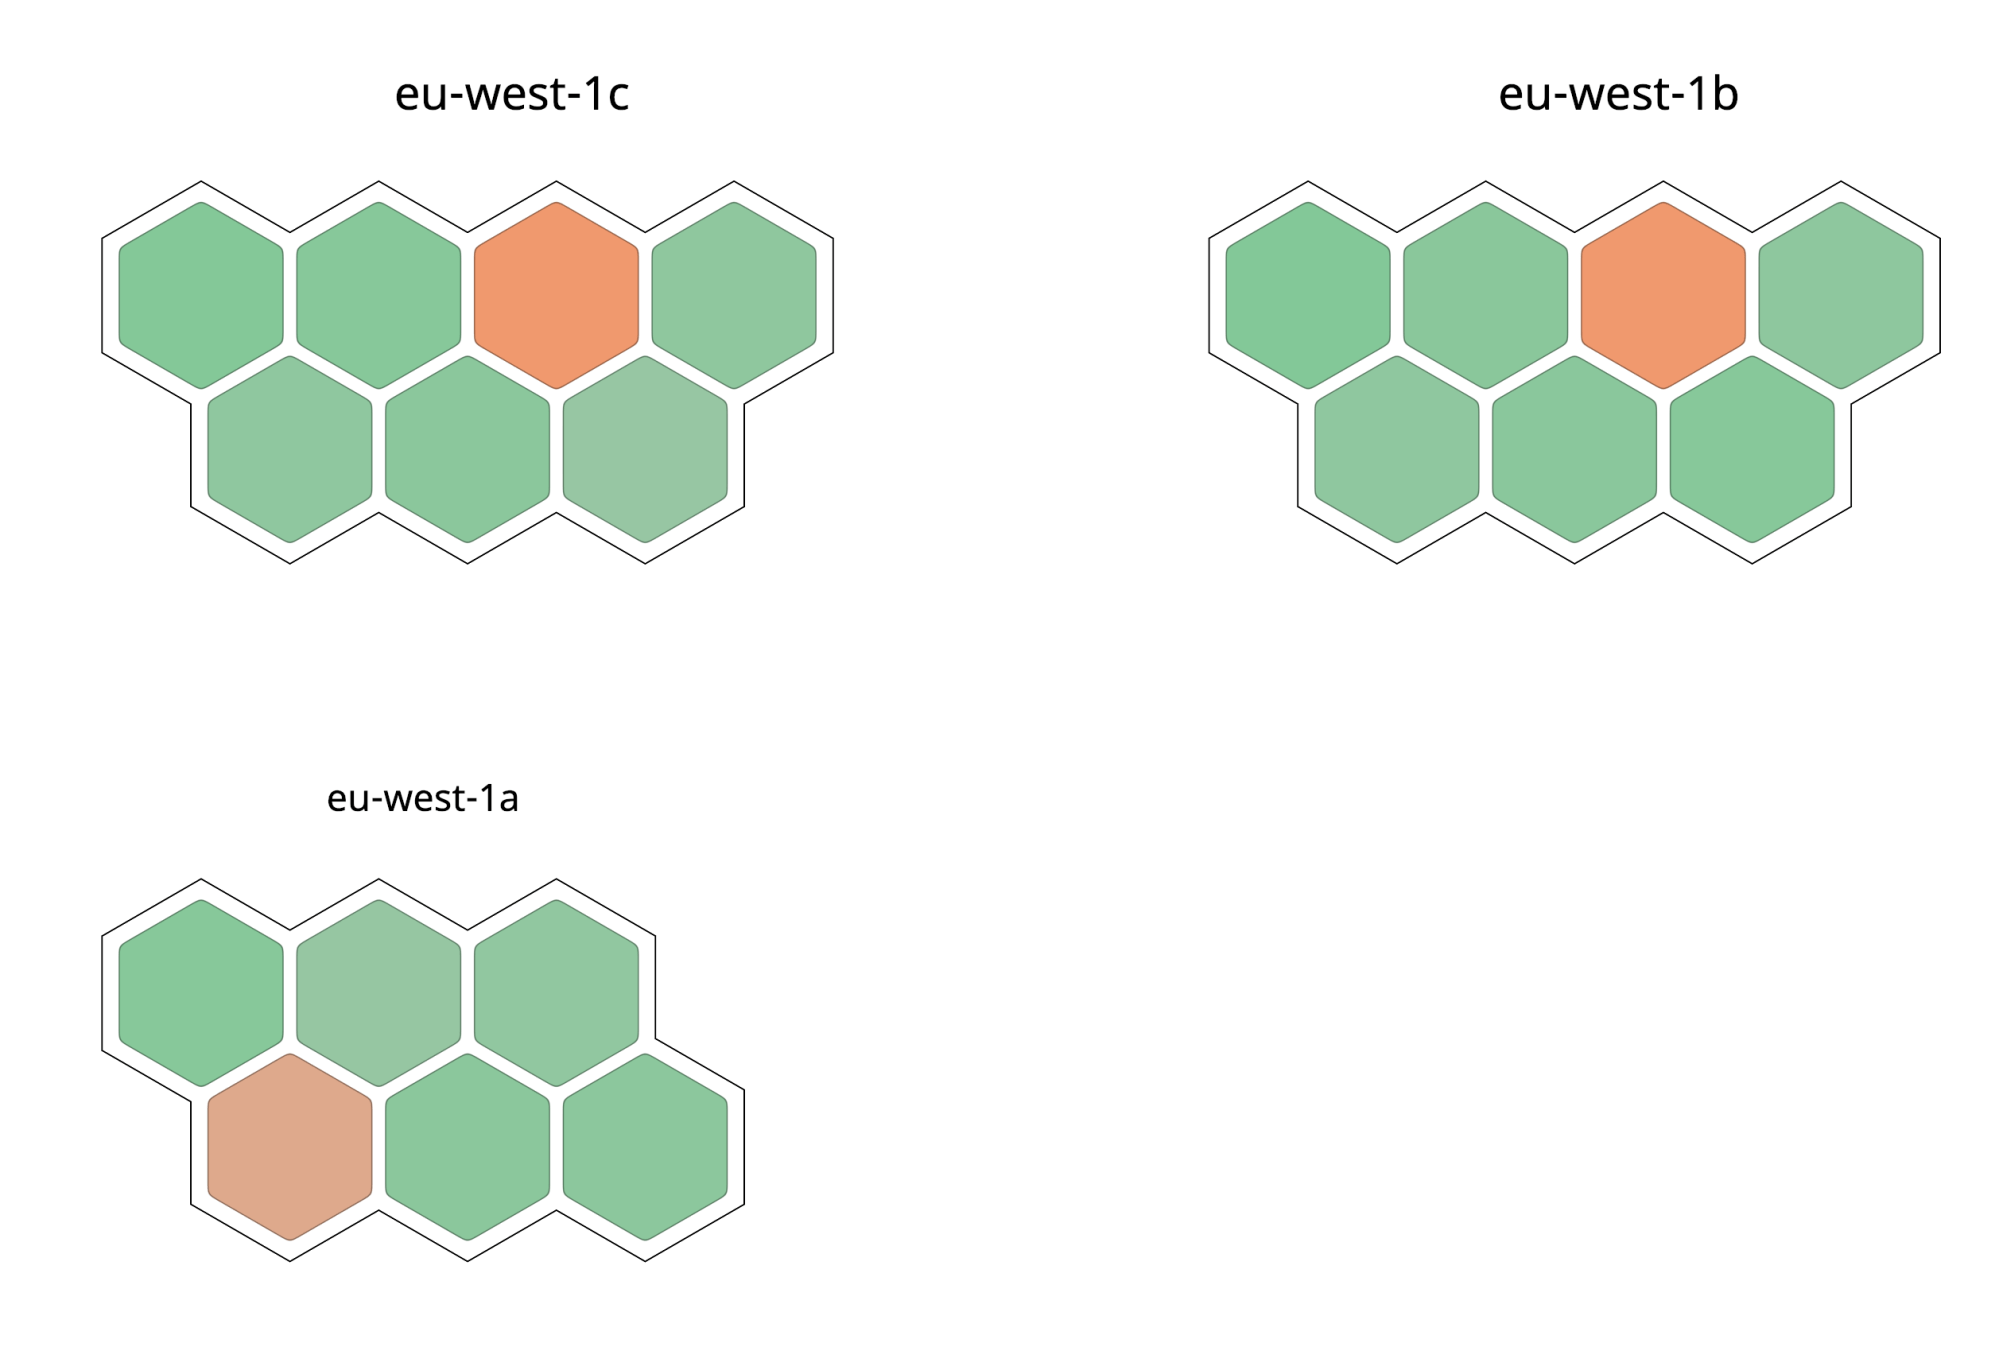
Datadog has a range of powerful monitoring features. The host map gives you a visualization of your nodes over the AWS availability zones. The colours in the map represent the relative CPU utilization for each node, green displaying a low level of CPU utilization and orange displaying a busier CPU.
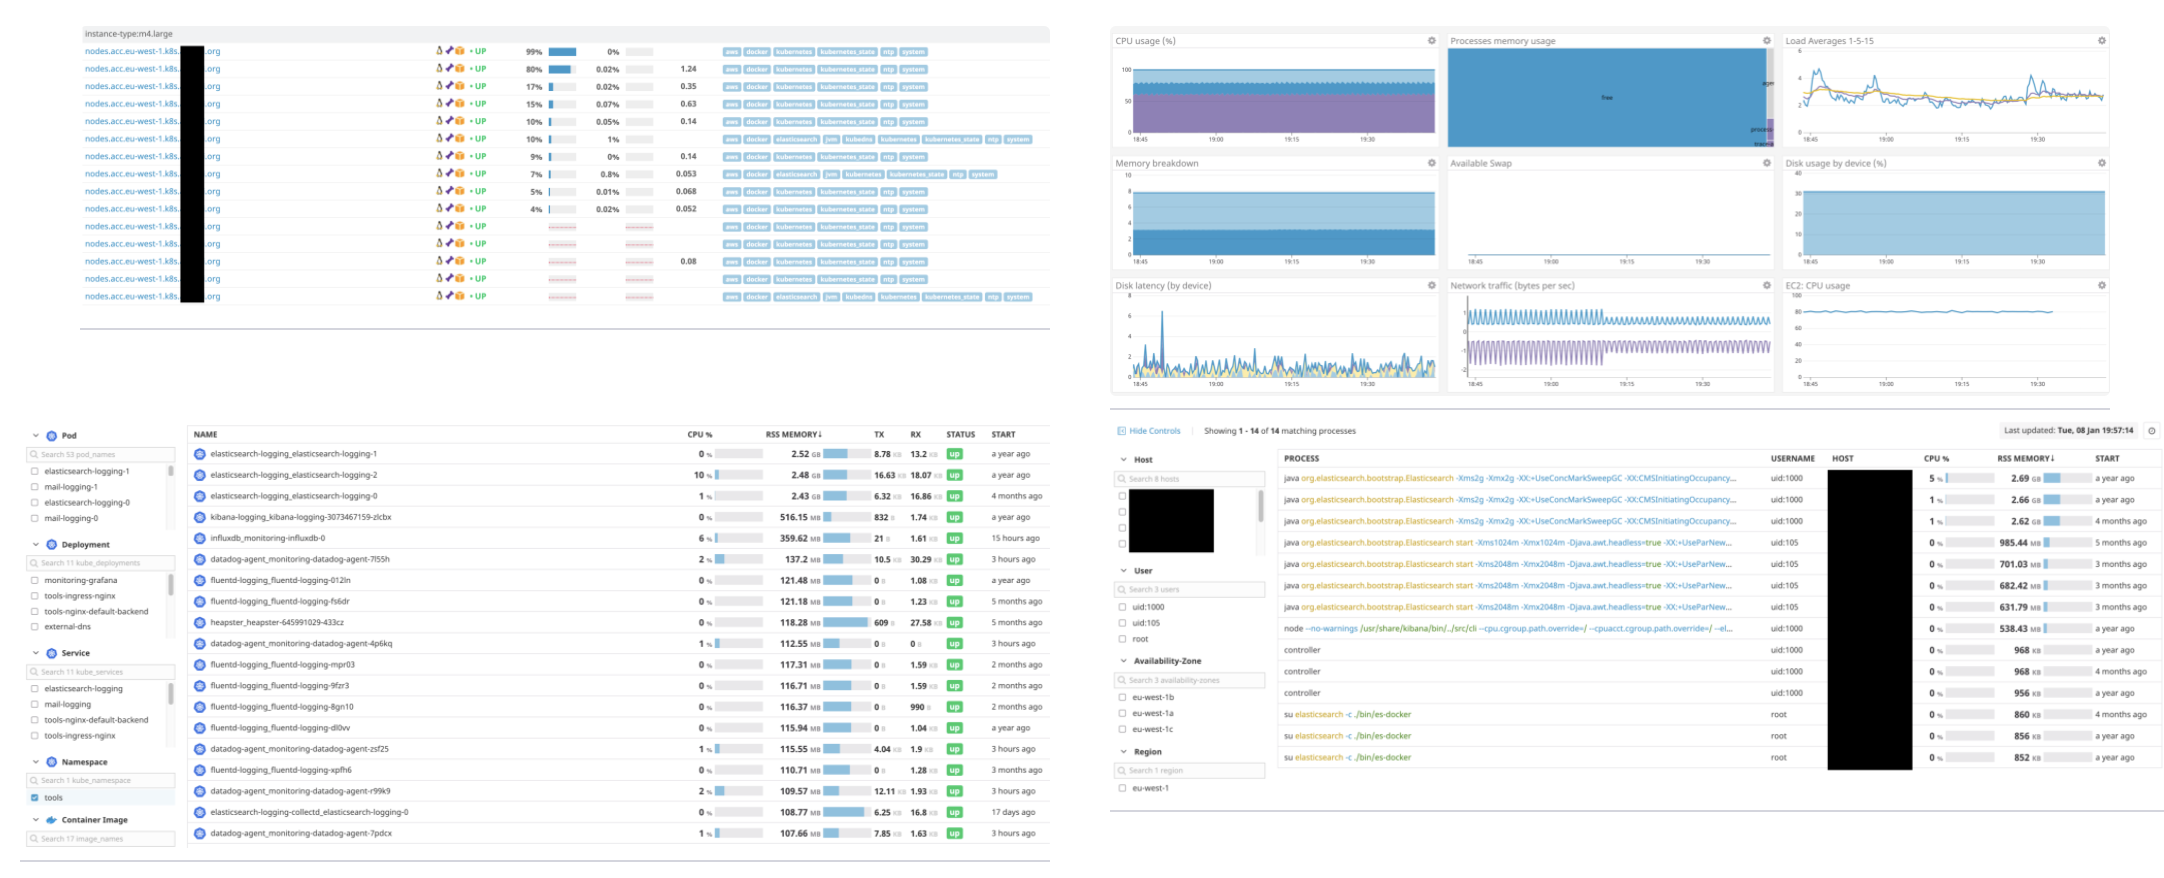
Each node is visible in the infrastructure list. Selecting one of the nodes reveals its details. You can monitor containers in the container view and see more details (e.g. graphs which visualize a trend) by selecting a specific container. Last but not least, processes can be monitored separately from the process list, with trends visible for every process. These fine-grained viewing levels make it easy to quickly pinpoint problems and generally lead to faster response times.
All data is available to create beautiful dashboards and good monitors to alert on failures. The creation of these monitors can be scripted, making it fairly easy to set up additional accounts and setups. Easy to see why Datadog is indispensable in our solutions… 😉
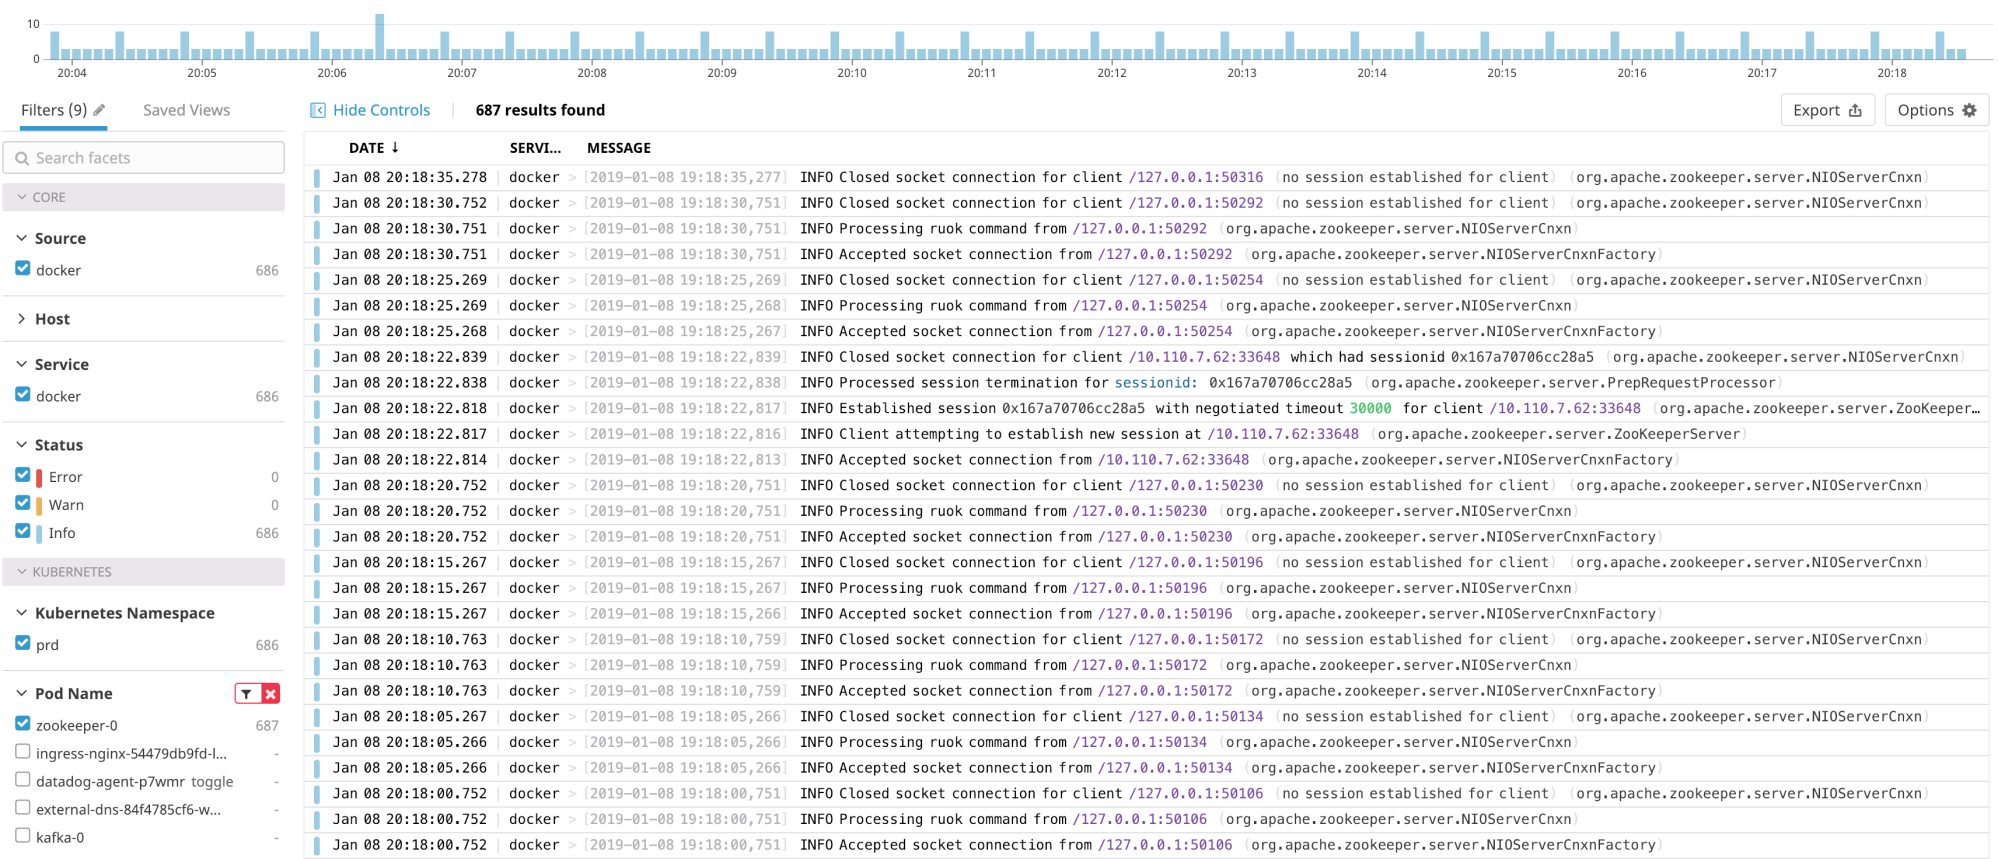
Logging with Datadog Logs
Datadog Logs is a little bit less mature than the monitoring part, but it’s still one of our favourite logging solutions. It’s relatively cheap and the same agent can be used for both monitoring and logging.
Monitors – which are used to trigger alerts – can be created from the log data and log data can also be visualized in dashboards. You can see the logs by navigating here and filter them by container, namespace or pod name. It’s also possible to filter your logs by label, which you can add to your Deployment, StatefulSet, …
Setting up additional Datadog integrations
As you’ve noticed, Datadog already provides a lot of data by default. However, extra metric collection and dashboards can easily be added by adding integrations. Datadog claims they have more than 200 integrations you can enable.
Here’s a list of integrations we usually enable on our clusters:
- AWS
- Docker
- Kubernetes
- Kafka
- Zookeeper
- ElasticSearch
- OpsGenie
Installing integrations is usually a very straightforward process. Some of them can be enabled with one click, others require some extra configuration. Let’s take a deeper look at setting up some of the above integrations.
AWS Integration
Setup
This integration should be configured both on the Datadog and AWS side. First, in AWS, we need to create a IAM Policy and a AssumeRolePolicy to allow access from Datadog to our AWS account.
AssumeRolePolicy
{
"Effect": "Allow",
"Principal": {
"AWS": "arn:aws:iam::464622532012:root"
  },
  "Action": "sts:AssumeRole",
  "Condition": {
    "StringEquals": {
      "sts:ExternalId": "${var.Datadog_aws_external_id}"
    }
  }
}
The content for the IAM Policy can be found here. Attach both Policies to an IAM Role called DatadogAWSIntegrationRole. Go to your Datadog account setting and press on the “+Available” button under the AWS integration. Go to the configuration tab, replace the variable ${var.Datadog_aws_external_id} in the policy above with the value of AWS External ID.
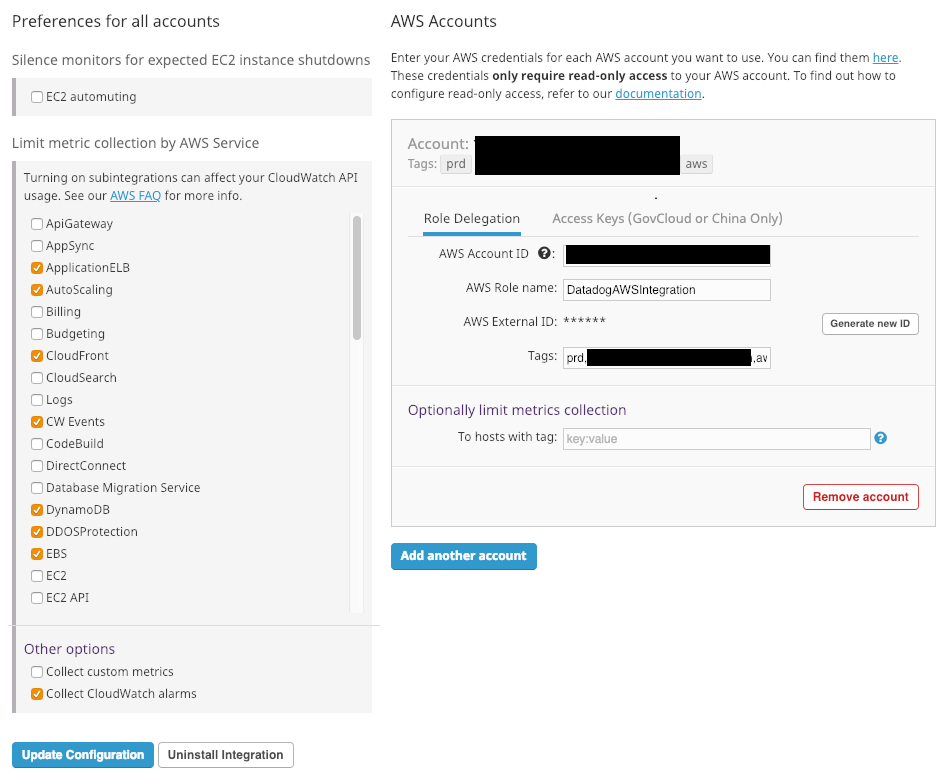
Add the AWS account number and for the role use DatadogAWSIntegrationRole as created above. Optionally, you can add tags which will be added to all metric gathered by this integration. On the left, limit the selection to the AWS services you use. Lastly, save the integration and your AWS integration (and integration for the enabled AWS Services) will be shown under “Installed”.
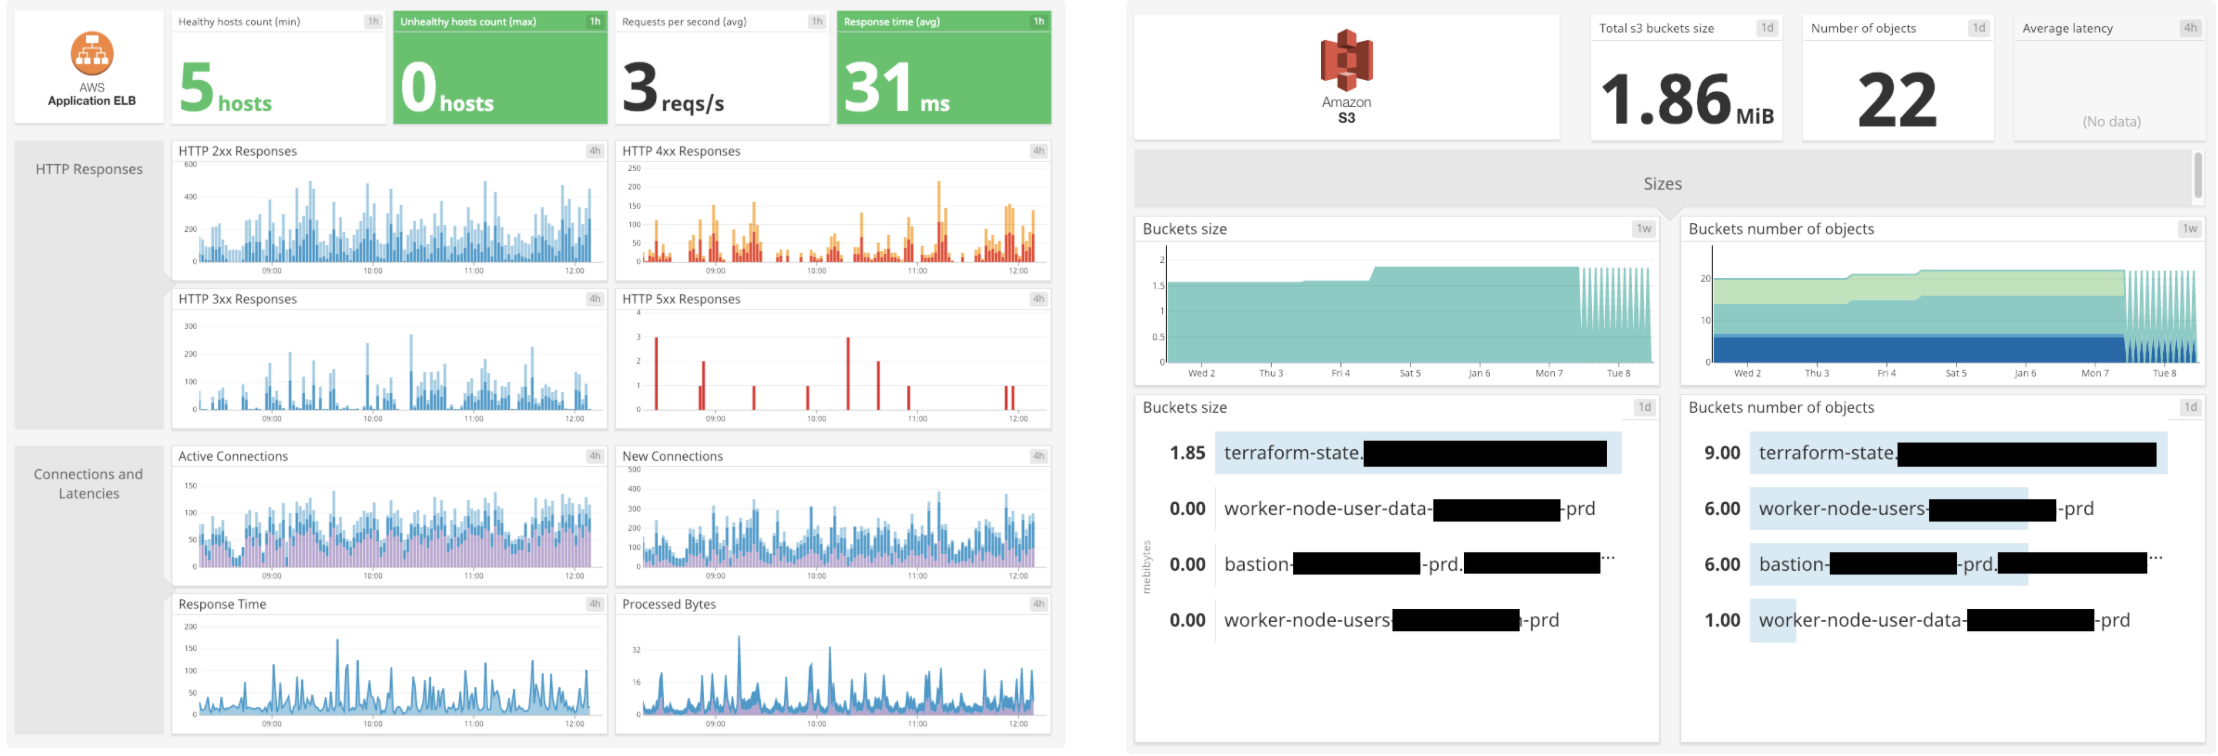
Integration in action
When you go to your dashboard list, you’ll see some new interesting dashboards with new metrics you can use to create new monitors with, such as:
- Database (RDS) memory usage, load, cpu, disk usage, connections
- Number of available VPN tunnels for a VPN connection
- Number of healthy hosts behind a load balancer
- ...
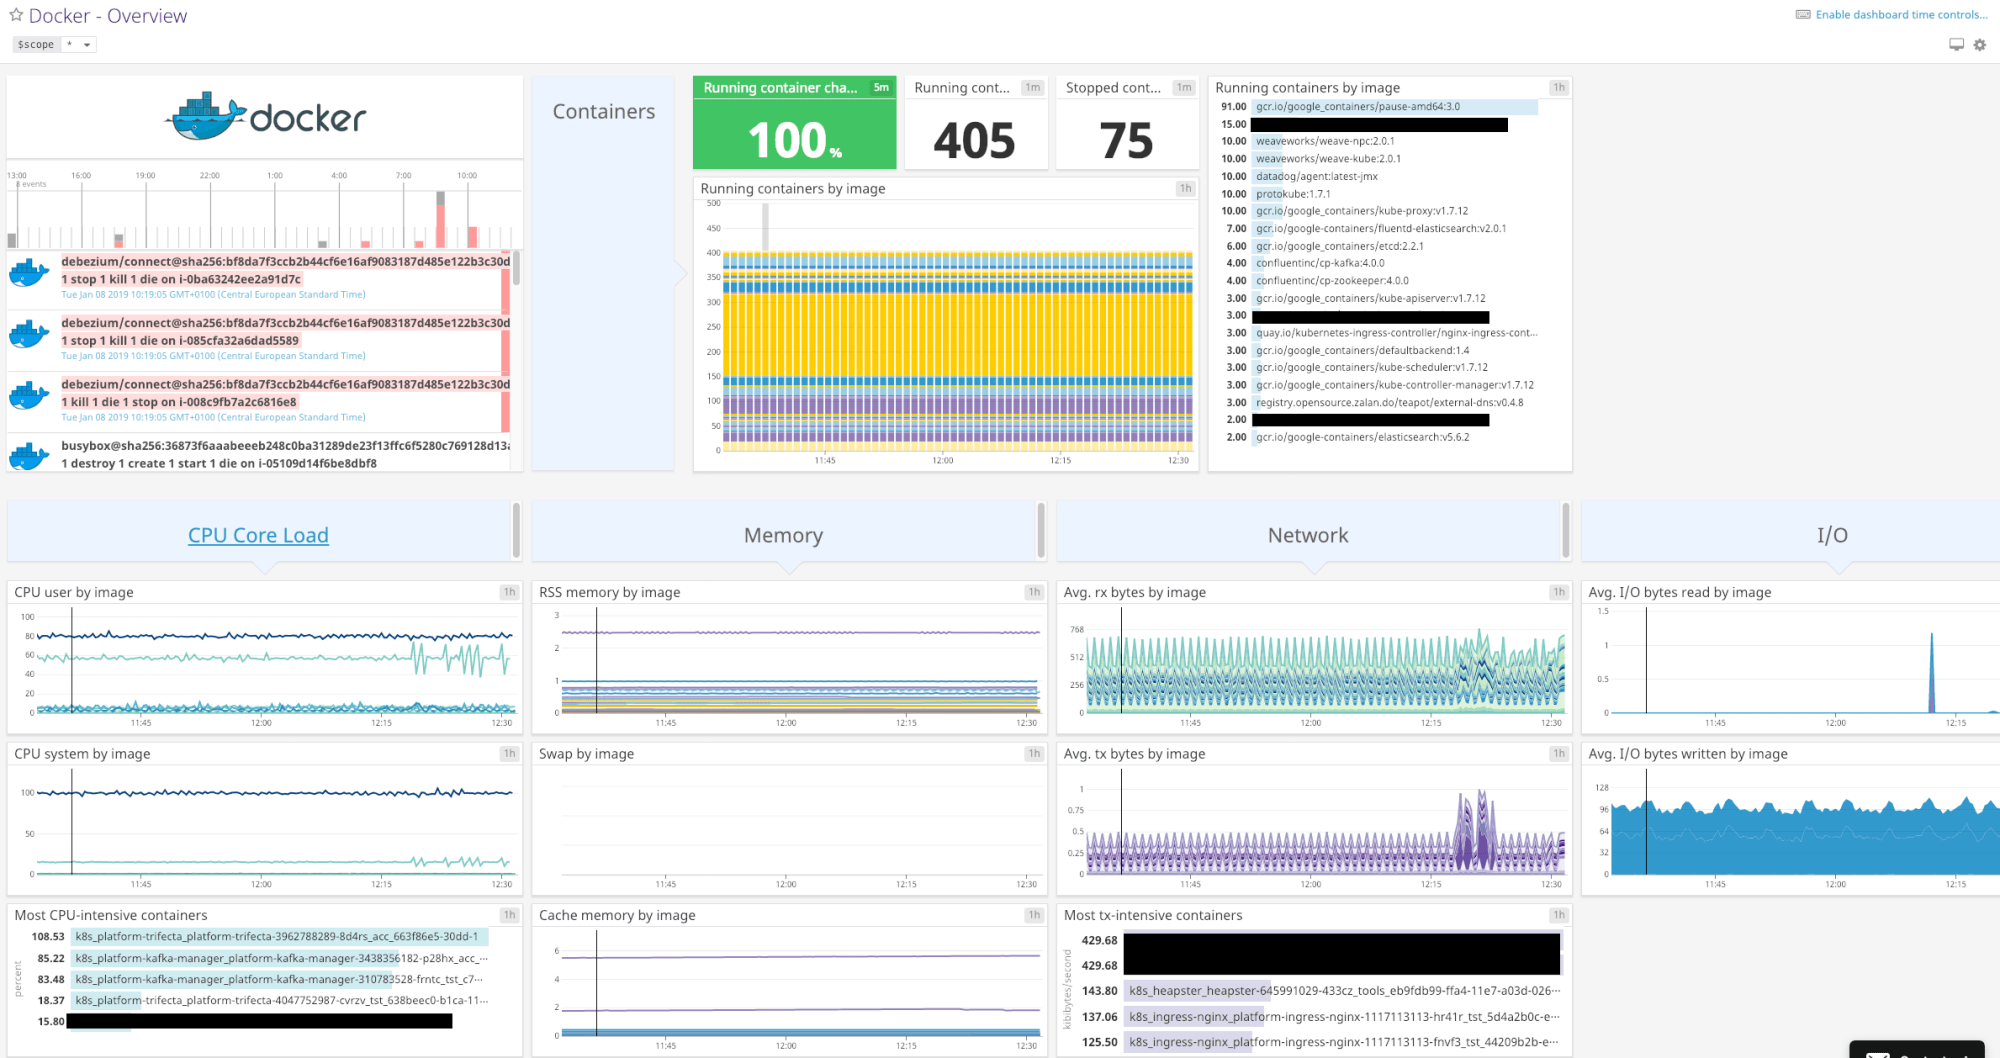
Docker Integration
Enabling the Docker integration is as easy as pressing the “+Available” button. A “Docker – Overview” dashboard is available as soon as you enable the integration.
Kubernetes Integration
Just like the Docker integration above, enabling the Kubernetes integration is as easy as pressing the “+Available” button, with a “Kubernetes – Overview” dashboard available as soon as you enable the integration.
🚀 Takeaway
The goal of this article was to show you how Datadog can become your most indispensable tools in your monitoring and logging infrastructure. Setup is pretty easy and there is so much information that can be collected and visualized effectively.
If you can create a good set of monitors so Datadog alerts in case of degradation or increased error rates, most incidents can be solved even before they become actual problems. You can script the creation of these monitors using the Datadog API, reducing the setup time of your monitoring and alerting framework drastically.
Do you want more information, or could you use some help setting up your own EKS cluster with Datadog monitoring? Don’t hesitate to contact us!


