
IT Problem-Solving: Part 2. Real-world example - Revolutionizing Train Arrival Detection
In Part 1. The Scientific Method, we explored the scientific method's application to solving business challenges. In Part 2, we dive into a real-world problem and demonstrate how the scientific method is employed at ACA to revolutionize train arrival detection for a client.
In Part 1. The Scientific Method, we explored the scientific method's application to solving business challenges. In Part 2, we dive into a real-world problem and demonstrate how the scientific method is employed at ACA to revolutionize train arrival detection for a client.
The Challenge: Detecting Train Arrival with Precision
The journey began with a client's question: "Can we accurately detect train arrivals and departures at a platform within a few seconds?" To address this, we applied the scientific method's iterative approach, encompassing five key steps:
- Identify and analyze the problem
- Form a hypothesis
- Conduct experiments to test the hypothesis
- Analyze data
- Conclude on the results
Solving a question like the above usually takes a few iterations to come to a fully satisfying result.
Iteration 1: Where do we even start?
Step 1: Identify and Analyze the Problem
The research question is the following: "Is it possible to detect the arrival and departure of a train at a platform with the time resolution of a few seconds using a smartphone?" In the first step it is important to analyze the problem: understanding the properties of arrival and departure. Taking into account the project limitations, these properties can be measured using the GPS functionality in a smartphone. Furthermore, the velocity is accurately available in the received data as it is measured using the Doppler shift of the carrier frequencies.
In this case, we could rely on established knowledge and assumptions, providing a solid starting point for problem-solving. If no known truths exist, you should conduct preliminary investigations, in this case we had earlier work to rely on.
Step 2: Form a Hypothesis
Our hypothesis: “When we collect the position and velocity with aGPS, we will be able to reliably determine the arrival and departure at a platform based on the position and velocity characteristics, and with a good time resolution.”
The hypothesis is measurable, which is important to setup an experiment where labeled data points can be compared to the predicted data.
Step 3: Conduct Experiments to test the hypothesis
In step 3, we set up a proof of concept focusing on essential data and the proposed solution to avoid unnecessary details before proving the hypothesis. We developed an app storing aGPS info and velocity labeled for driving or standing still. Knowing aGPS limitations, we applied filters using accelerometer data, train constraints, and predicted routes, significantly improving location accuracy. This resulted in a significant improvement of the location data.
Step 4: Analyze Data
The results of the experiments:
- Successful detection of arrival and departure at a platform
- Excellent system stability
- Unreliable velocity due to inconsistent availability based on location data origin
- Insufficient time resolution, resulting in unpredictable location output.
Step 5: Conclude on the Results
Despite good initial results, the proposed solution didn't meet the essential time resolution requirement. Constructing a system with a consistent output rate becomes unfeasible while driving within a massive Faraday cage capable of blocking signals.
Iteration 2: Back to the drawing board
Step 1: Identify and Analyze the Problem
The first iteration didn't meet expectations, but that didn't discourage us. We realized the oversight in time resolution. Furthermore, during that time at ACA we successfully applied new techniques on a similar problem.
The accelerometer provided reliable data, and by combining it with the gyroscope and magnetometer, we obtained directional acceleration. Anticipating distinct acceleration patterns for different transportation modes and states, such as standstill and driving, we decided to leverage a Naïve Bayes algorithm. This supervised learning algorithm creates a probabilistic classifier, predicting standstill and driving based on measured properties.
Step 2: Form a Hypothesis
A new hypothesis emerged: "Naïve Bayes classifier can be used to differentiate between walking acceleration pattern and its super position with a train in motion acceleration pattern."
Step 3: Conduct Experiments to test the hypothesis
An application was created to collect data that was labeled with the correct state. Then, we trained the Naïve Base classifier using various data features, such as maximum, minimum, mean, norm, standard deviation, distance to the platform, and minimum required velocity.
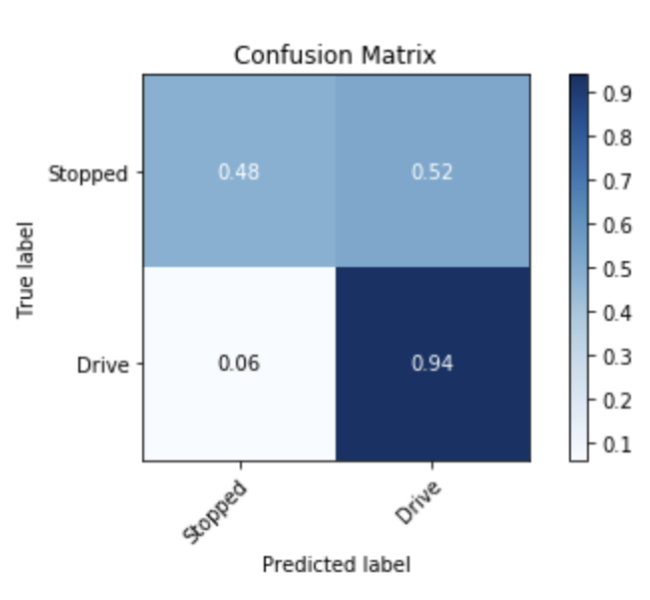
Step 4: Analyze Data
Multiple classifiers were trained, tested, and assessed using confusion matrices. The results showed driving was correctly identified 94% of the time, but standstill was only identified accurately 48% of the time, with the classifier mistakenly labeling standstill as driving in 52% of cases.
Step 5: Conclude on the Results
The Naïve Bayes classifiers lacked the needed accuracy for our problem. The features had significant overlap, preventing differentiation between standstill and driving. Additionally, the classifiers couldn't capture the transient nature of arrival and departure accurately, prompting further exploration for a solution.
Iteration 3: It is all about the change
Step 1: Identify and Analyze the Problem
The previous experiments revealed that velocity and position lacked sufficient time resolution, and probabilistic models struggled with the transient nature of arrival and departure. Recognizing the importance of the transient aspect, it's evident that properties like velocity or position aren't crucial; instead, acceleration is key. Arrival can be defined as a deceleration followed by a period of no acceleration, while departure is acceleration preceded by a period of no acceleration.
Step 2: Form a Hypothesis
A new hypothesis was formulated: “It is possible to use the transient nature of arrival and departure at a platform to detect the arrival and departure with a good time resolution and good accuracy.”
Step 3: Conduct Experiments to test the hypothesis
To focus on using accelerometer data for arrival and departure detection, we utilized data from the previous iteration, entering a new research domain aiming to build a signal analysis algorithm for classification.
In the following steps, multiple graphs are added. The red background indicates that the train was at the platform, green indicates that it was in motion.
- Look at the data:
Take a look at the graph of the Y-channel of the accelerometer. We chose not to project the acceleration onto the real-world axis initially to keep it in its raw form, minimizing the required computing power.
There wasn’t much to tell our program with this data, it looks mostly random.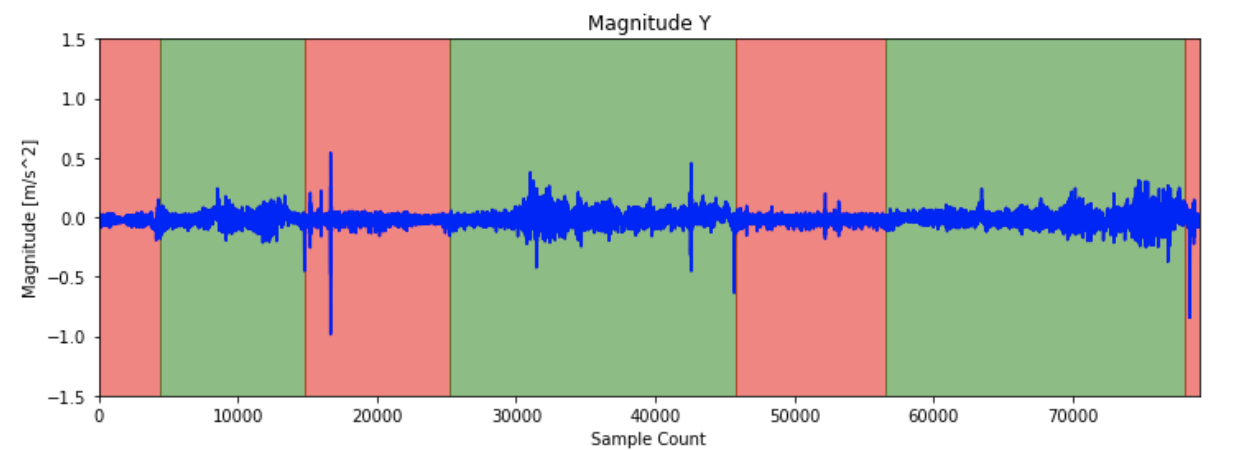
- Perform data manipulations to improve clarity:
Velocity remains constant during driving and standstill, but arrival and departure are characterized by changes in acceleration. Arrival involves deceleration followed by no acceleration, while departure involves acceleration after a period of no acceleration. Accumulating acceleration over time reveals trends similar to velocity but with notable changes during arrival and departure, providing insights for program interpretation, though further signal processing is necessary.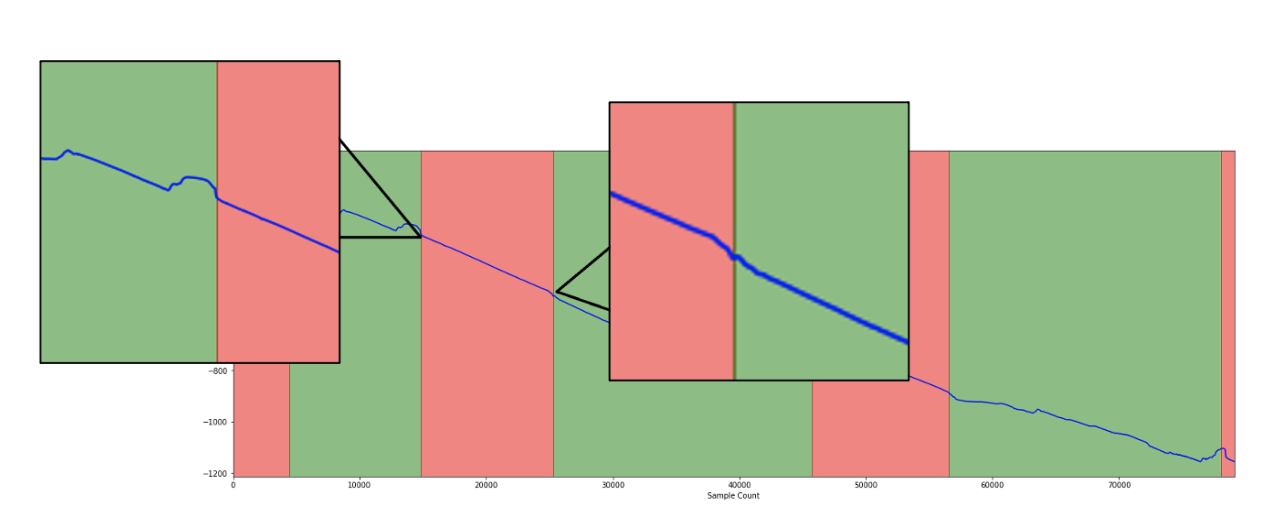
- Calculate the Gradient:
To avoid the original data being retrieved by taking the gradient from the cumulative curve, additional data manipulation is performed. The cumulative curve undergoes smoothening through a one-second moving average. On a macroscopic level, the curve retains its appearance, but noise in the data is reduced. The resulting graph, incorporating all three channels for completeness, is obtained by taking the gradient.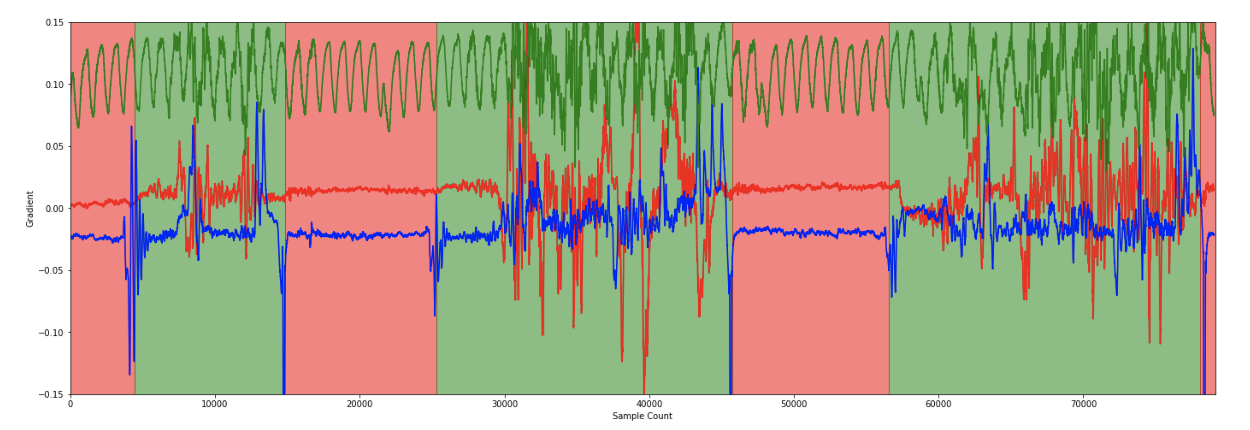
- Clean Up the Data:
The current data remains noisy and challenging for program interpretation. In standstill regions (red area), minimal acceleration is observed, while the driving area exhibits significant fluctuations. This challenges the notion of constant velocity during motion, attributed to train vibrations and acceleration/deceleration. Contrary to constant velocity beliefs, this disparity between states enhances the likelihood of finding a viable solution, addressing both states rather than just the transition between standstill and driving. To enhance data quality, a high-pass filter is applied, removing drift (green and blue curve not centered around 0) and electronic noise (constant frequency in the green curve). The results are as follows: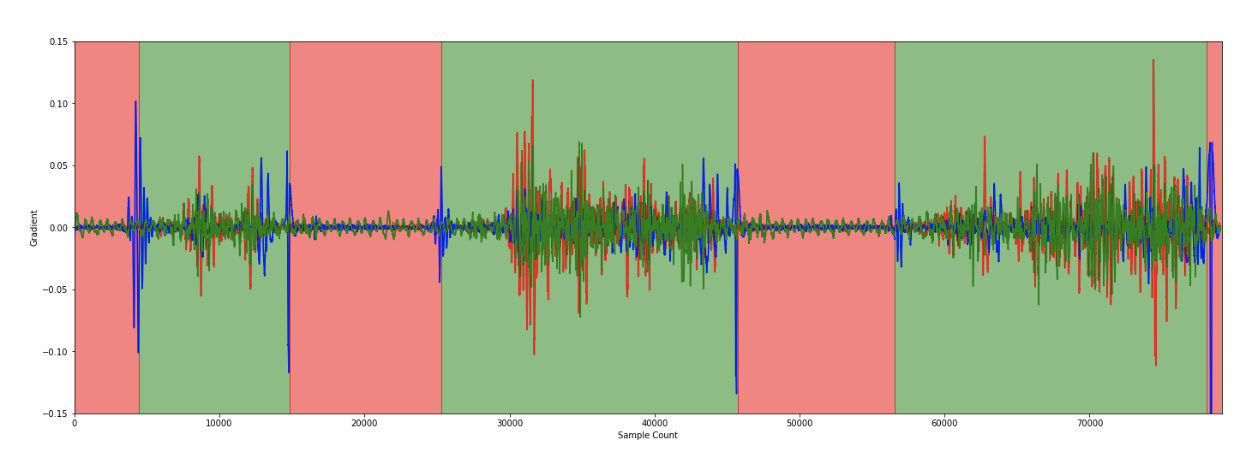
- Ignore Sign of Acceleration:
To disregard the acceleration's directionality, we eliminate signs and channels are combined by taking the absolute value and summing the three channels. To mitigate remaining data noise, a cut-off is applied, ignoring insignificant acceleration.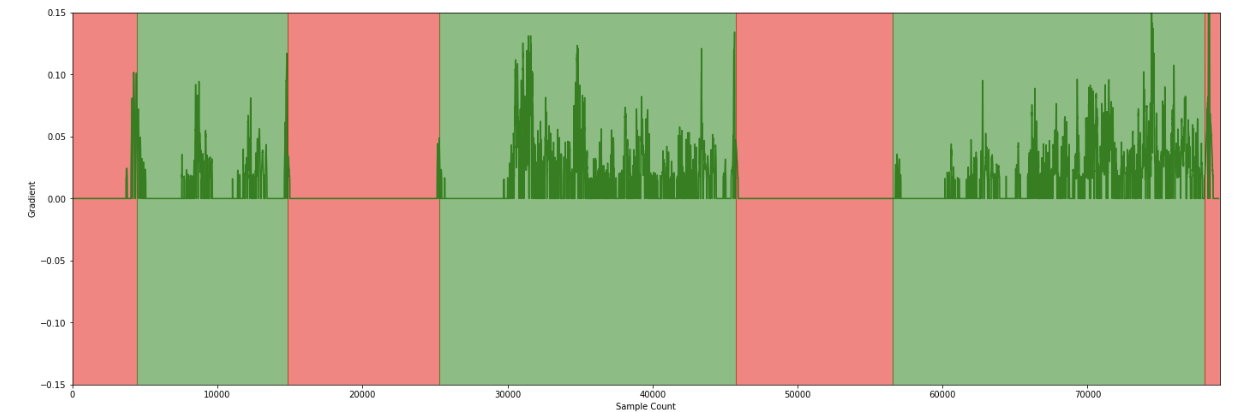
Using this processed data, a straightforward algorithm is devised for determining arrival and departure. As previously mentioned, arrival is characterized by deceleration followed by no acceleration, while departure is acceleration after a period of none. This distinction is evident in the graph, where +1 indicates departure, and -1 indicates arrival at the platform.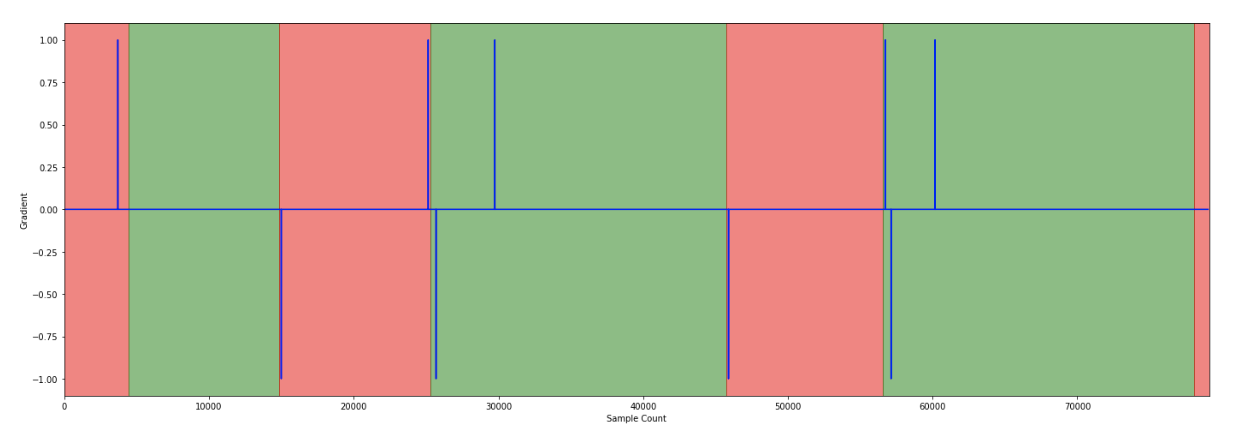
Step 4: Analyze Data
Data analysis occurred primarily during the experiment. Subsequently, our algorithm was tested with unused data, revealing some false positives but no false negatives. This facilitates data optimization. While data cannot be generated from nothing, combining measurements with aGPS data helps filter out false positives.
Step 5: Conclude on the Results
The algorithm that was developed in this iteration of the scientific method, proved our last hypothesis.
“It is possible to use the transient nature of arrival and departure at a platform to detect the arrival and departure with a good time resolution and good accuracy.”
Conclusion: A Journey to Precision
In this blog post, we detailed the complete process to solving a complex problem with precision. Through iterations, learning from failures, and discarding assumed knowledge, we crafted a reliable solution.
The algorithm, combining known mathematics with aGPS data, can accurately detect train arrival and departure at a platform using only a smartphone, achieving a time resolution of less than 1 second.
Do you want to know more about our proven IT problem-solving method?
Or looking for an experienced app development partner?
Contact our experts!