How to build a highly available Atlassian stack on Kubernetes
Within ACA, there are multiple teams working on different (or the same!) projects. Every team has their own domains of expertise, such as developing custom software, marketing and communications, mobile development and more. The teams specialized in Atlassian products and cloud expertise combined their knowledge to create a highly-available Atlassian stack on Kubernetes. Not only could we improve our internal processes this way, we could also offer this solution to our customers!
In this blogpost, we’ll explain how our Atlassian and cloud teams built a highly-available Atlassian stack on top of Kubernetes. We’ll also discuss the benefits of this approach as well as the problems we’ve faced along the path. While we’re damn close, we’re not perfect after all 😉 Lastly, we’ll talk about how we monitor this setup.
The setup of our Atlassian stack
Our Atlassian stack consists of the following products:
- Amazon EKS
- Amazon EFS
- Atlassian Jira Data Center
- Atlassian Confluence Data Center
- Amazon EBS
- Atlassian Bitbucket Data Center
- Amazon RDS
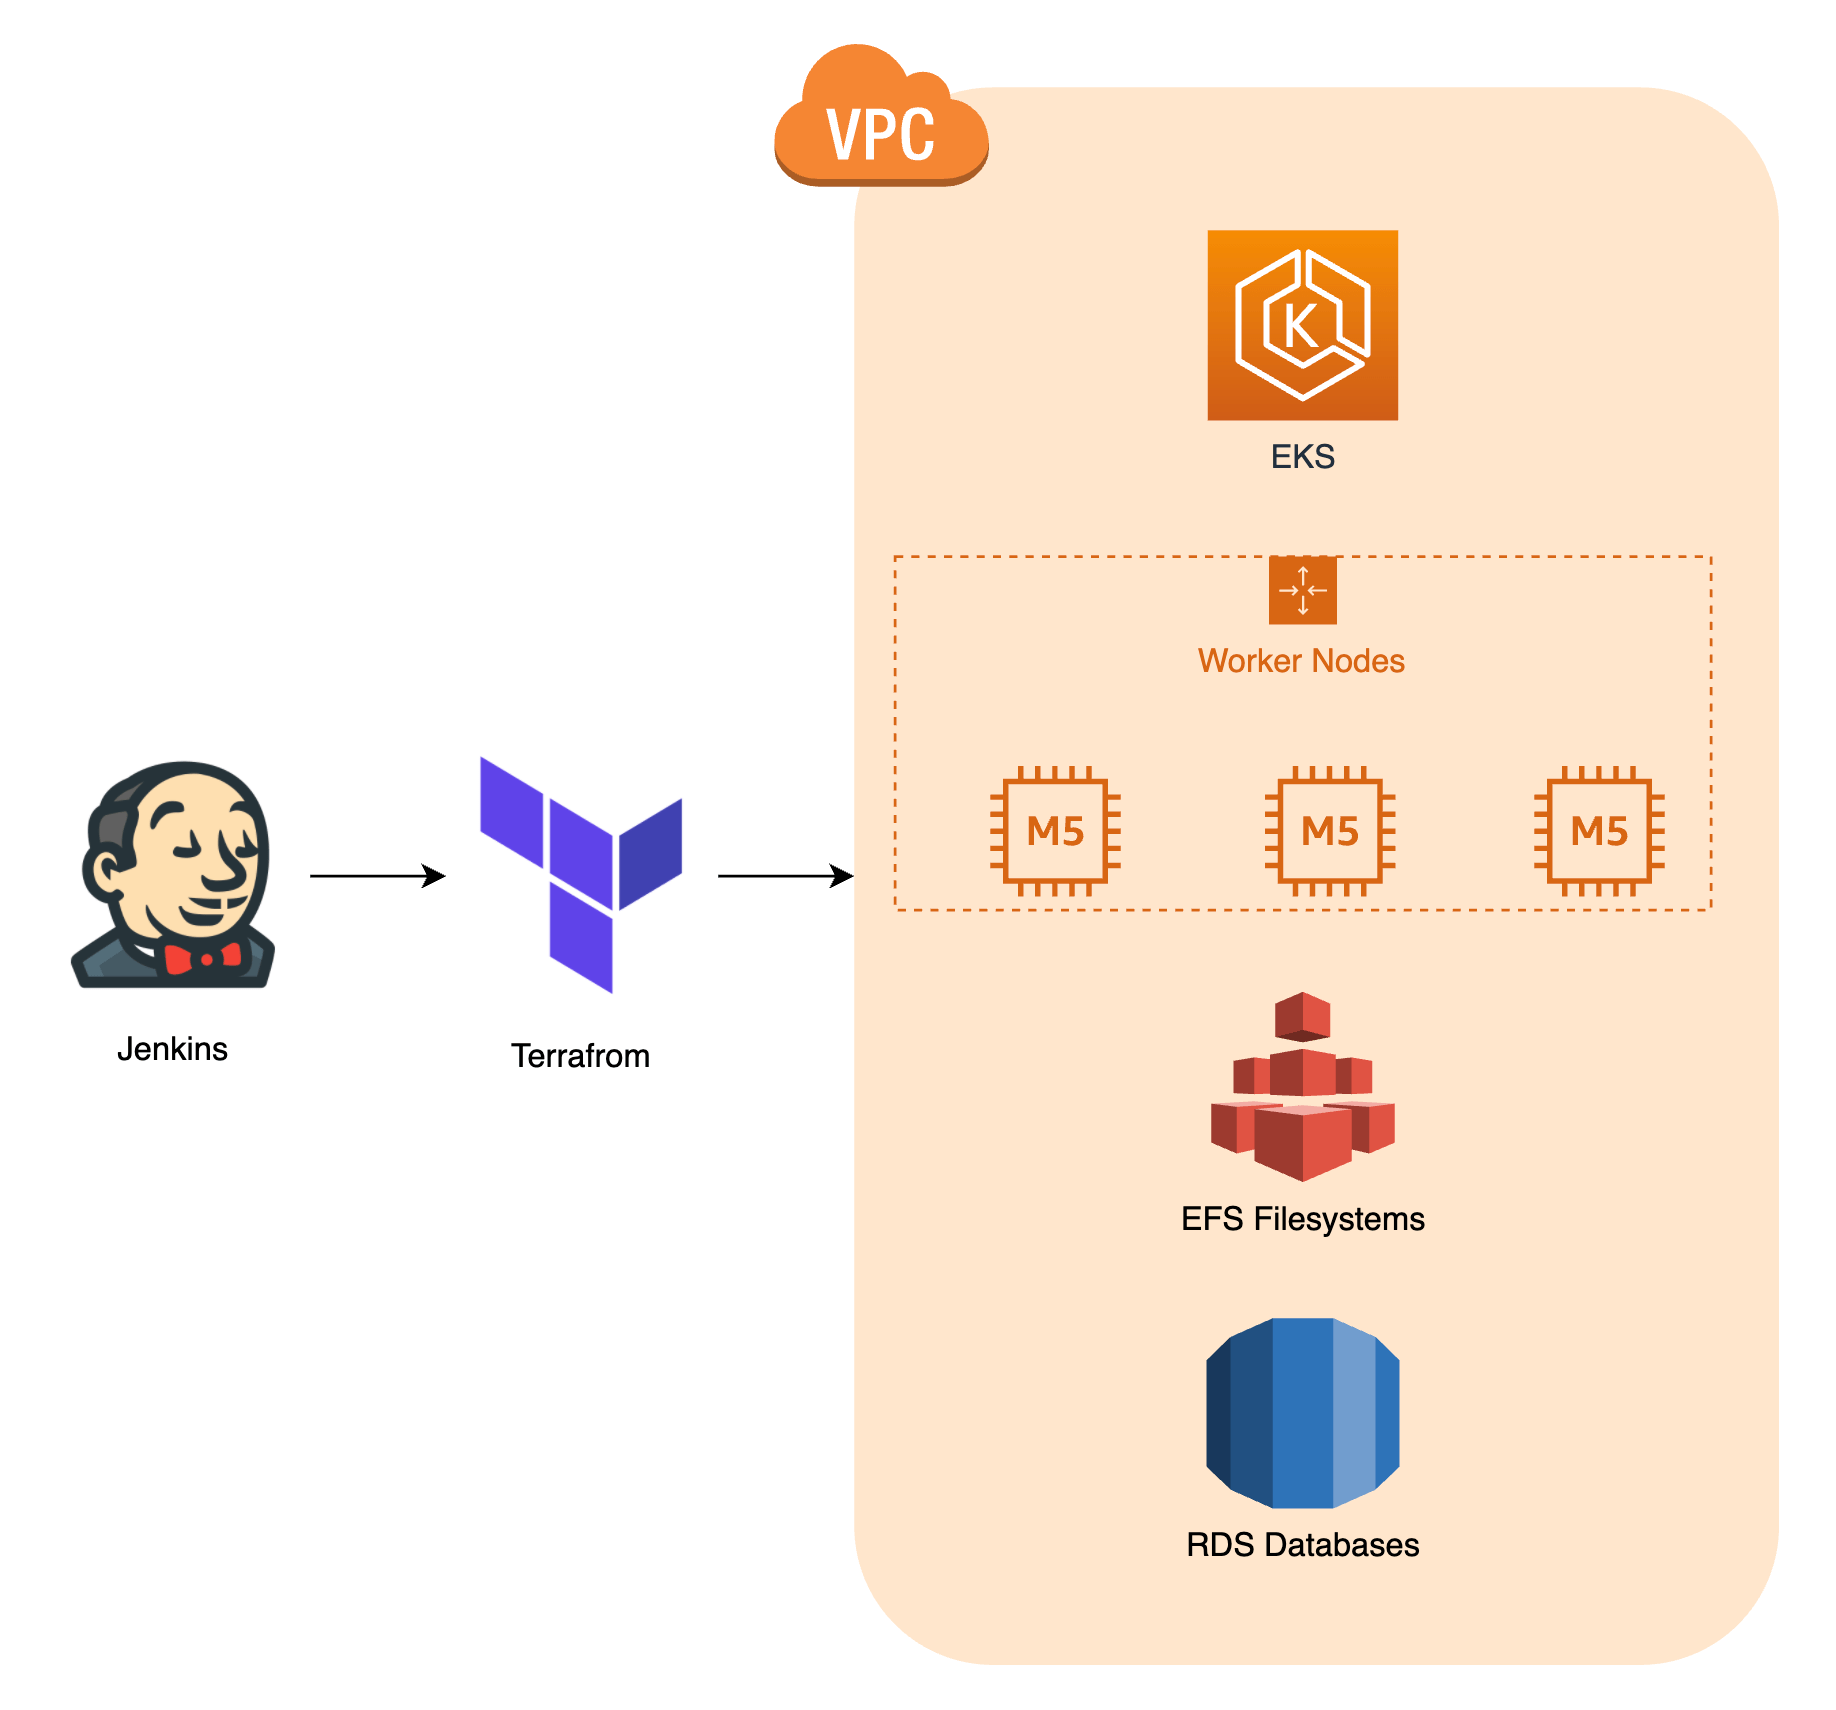
As you can see, we use AWS as the cloud provider for our Kubernetes setup. We create all the resources with Terraform. We’ve written a separate blog post on what our Kubernetes setup exactly looks like. You can read it here! The image below should give you a general idea.
The next diagram should give you an idea about the setup of our Atlassian Data Center.
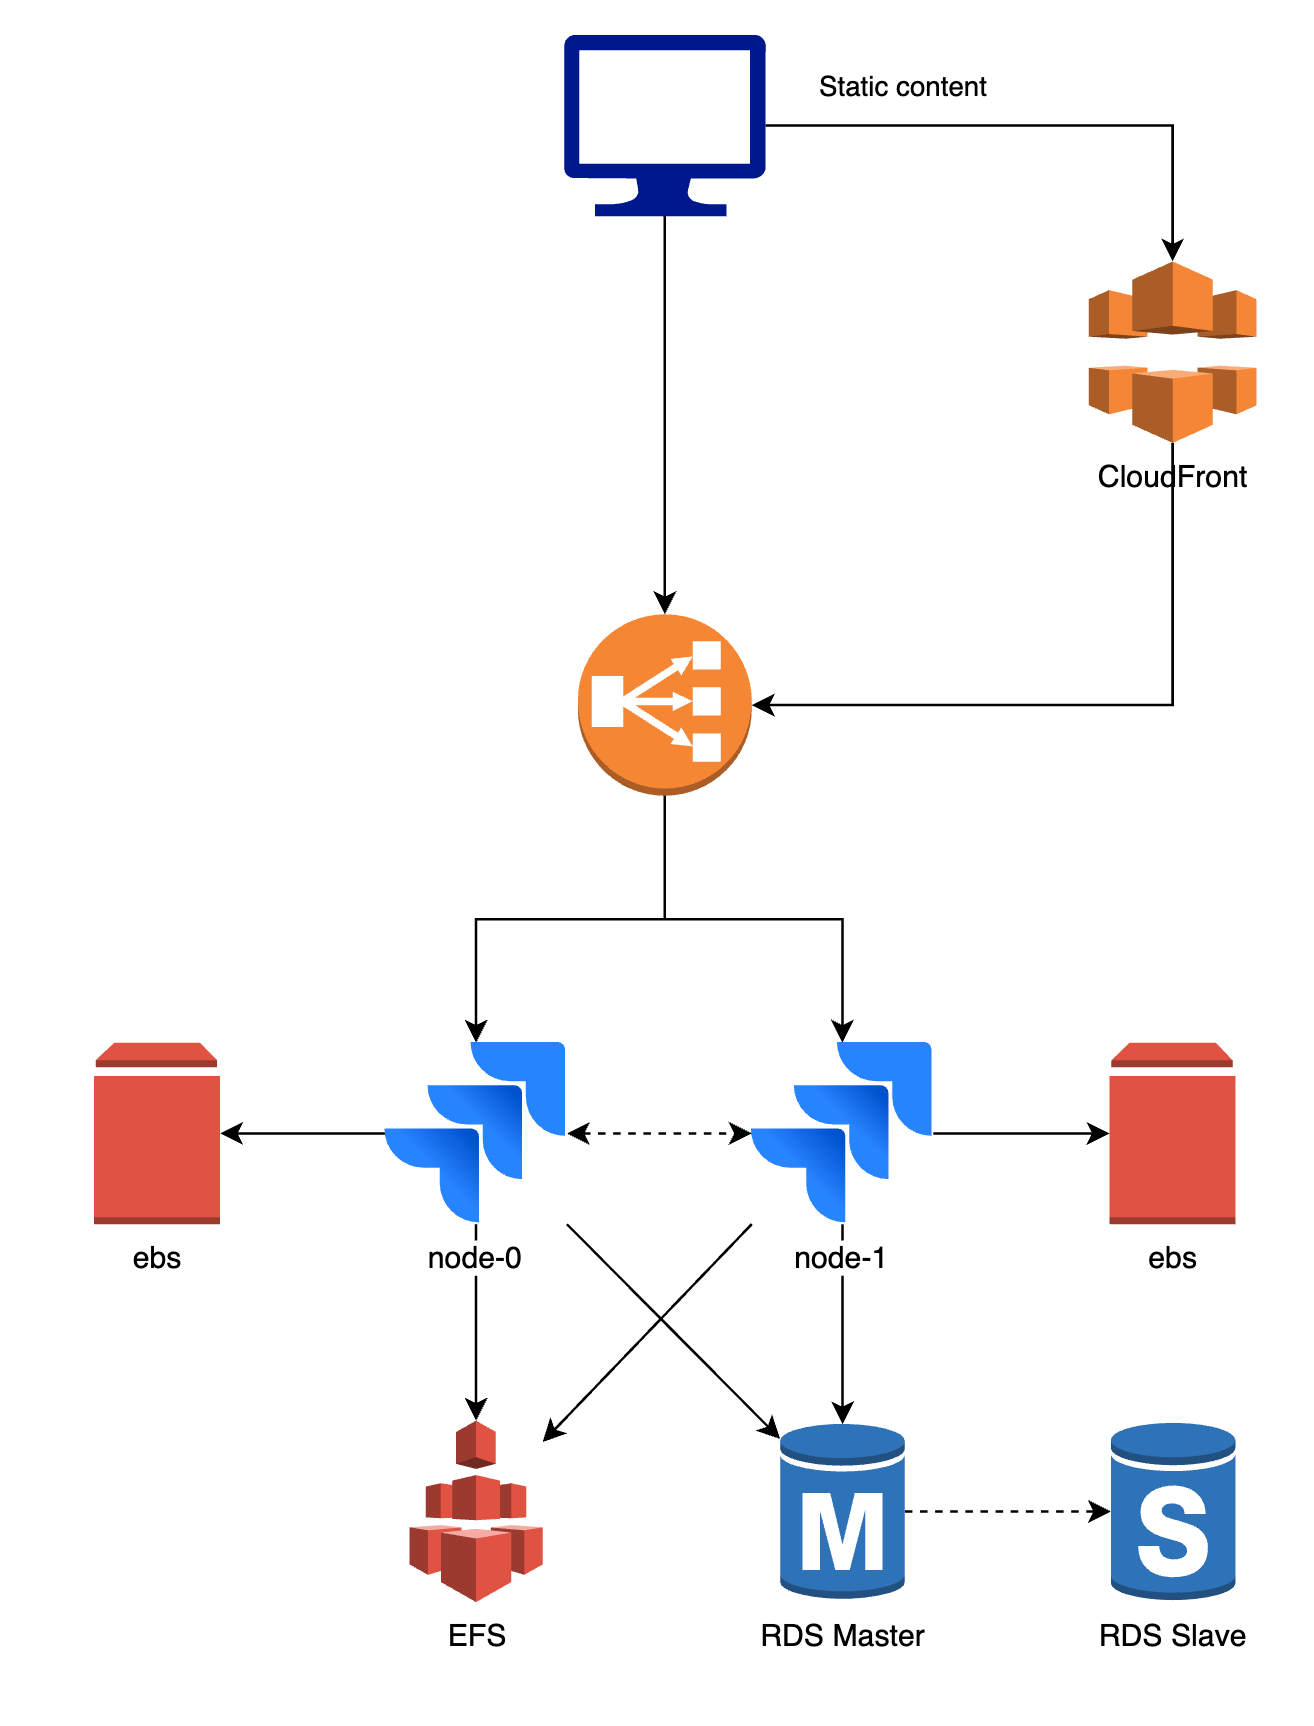
While there are a few differences between the products and setups, the core remains the same.
- The application is launched as one or more pods described by a StatefulSet. The pods are called node-0 and node-1 in the diagram above.
- The first request is sent to the load balancer and will be forwarded to either the node-0 pod or the node-1 pod. Traffic is sticky, so all subsequent traffic from that user will be sent to node-1.
- Both pod-0 and pod-1 require persistent storage which is used for plugin cache and indexes. A different Amazon EBS volume is mounted on each of the pods.
- Most of the data like your JIRA issues, Confluence spaces, … is stored in a database. The database is shared, node-0 and node-1 both connect to the same database. We usually use PostgreSQL on Amazon RDS.
- The node-0 and node-1 pod also need to share large files which we don’t want to store in a database, for example attachments. The same Amazon EFS volume is mounted on both pods. When changes are made, for example an attachment is uploaded to an issue, the attachment is immediately available on both pods.
- We use CloudFront (CDN) to cache static assets and improve the web response times.
The benefits of this setup
By using this setup, we can leverage the advantages of Docker and Kubernetes and the Data Center versions of the Atlassian tooling. There are a lot of benefits to this kind of setup, but we’ve listed the most important advantages below.
- It’s a self-healing platform: containers and worker nodes will automatically replace themselves when a failure occurs. In most cases, we don’t even have to do anything and the stack takes care of itself. Of course, it’s still important to investigate any failures so you can prevent them from occurring in the future.
- Exactly zero downtime deployments: when upgrading the first node within the cluster to a new version, we can still serve the old version to our customers on the second. Once the upgrade is complete, the new version is served from the first node and we can upgrade the second node. This way, the application stays available, even during upgrades.
- Deployments are predictable: we use the same Docker container for development, staging and production. It’s why we are confident the container will be able to start in our production environment after a successful deploy to staging.
- Highly available applications: when failure occurs on one of the nodes, traffic can be routed to the other node. This way you have time to investigate the issue and fix the broken node while the application stays available.
- It’s possible to sync data from one node to the other. For example, syncing the index from one node to the other to fix a corrupt index can be done in just a few seconds, while a full reindex can take a lot longer.
- You can implement a high level of security on all layers (AWS, Kubernetes, application, …)
- AWS CloudTrail prevents unauthorized access on AWS and sends an alert in case of anomaly.
- AWS Config prevents AWS security group changes. You can find out more on how to secure your cloud with AWS Config in our blog post.
- Terraform makes sure changes on the AWS environment are approved by the team before rollout.
- Since upgrading Kubernetes master and worker nodes has little to no impact, the stack is always running a recent version with the latest security patches.
- We use a combination of namespacing and RBAC to make sure applications and deployments can only access resources within their namespace with least privilege.
- NetworkPolicies are rolled out using Calico. We deny all traffic between containers by default and only allow specific traffic.
- We use recent versions of the Atlassian applications and implement Security Advisories whenever they are published by Atlassian.

Interested in leveraging the power of Kubernetes yourself? You can find more information about how we can help you on our website!
Problems we faced during the setup
Migrating to this stack wasn’t all fun and games. We’ve definitely faced some difficulties and challenges along the way. By discussing them here, we hope we can facilitate your migration to a similar setup!
- Some plugins (usually older plugins) were only working on the standalone version of the Atlassian application. We needed to find an alternative plugin or use vendor support to have the same functionality on Atlassian Data Center.
- We had to make some changes to our Docker containers and network policies (i.e. firewall rules) to make sure both nodes of an application could communicate with each other.
- Most of the applications have some extra tools within the container. For example, Synchrony for Confluence, ElasticSearch for BitBucket, EazyBI for Jira, and so on. These extra tools all needed to be refactored for a multi-node setup with shared data.
- In our previous setup, each application was running on its own virtual machine. In a Kubernetes context, the applications are spread over a number of worker nodes. Therefore, one worker node might run multiple applications. Each node of each application will be scheduled on a worker node that has sufficient resources available. We needed to implement good placement policies so each node of each application has sufficient memory available. We also needed to make sure one application could not affect another application when it asks for more resources.
- There were also some challenges regarding load balancing. We needed to create a custom template for nginx ingress-controller to make sure websockets are working correctly and all health checks within the application are reporting a healthy status. Additionally, we needed a different load balancer and URL for our BitBucket SSH traffic compared to our web traffic to the BitBucket UI.
- Our previous setup contained a lot of data, both on filesystem and in the database. We needed to migrate all the data to an Amazon EFS volume and a new database in a new AWS account. It was challenging to find a way to have a consistent sync process that also didn’t take too long because during migration, all applications were down to prevent data loss. In the end, we were able to meet these criteria and were able to migrate successfully.

Monitoring our Atlassian stack
We use the following tools to monitor all resources within our setup
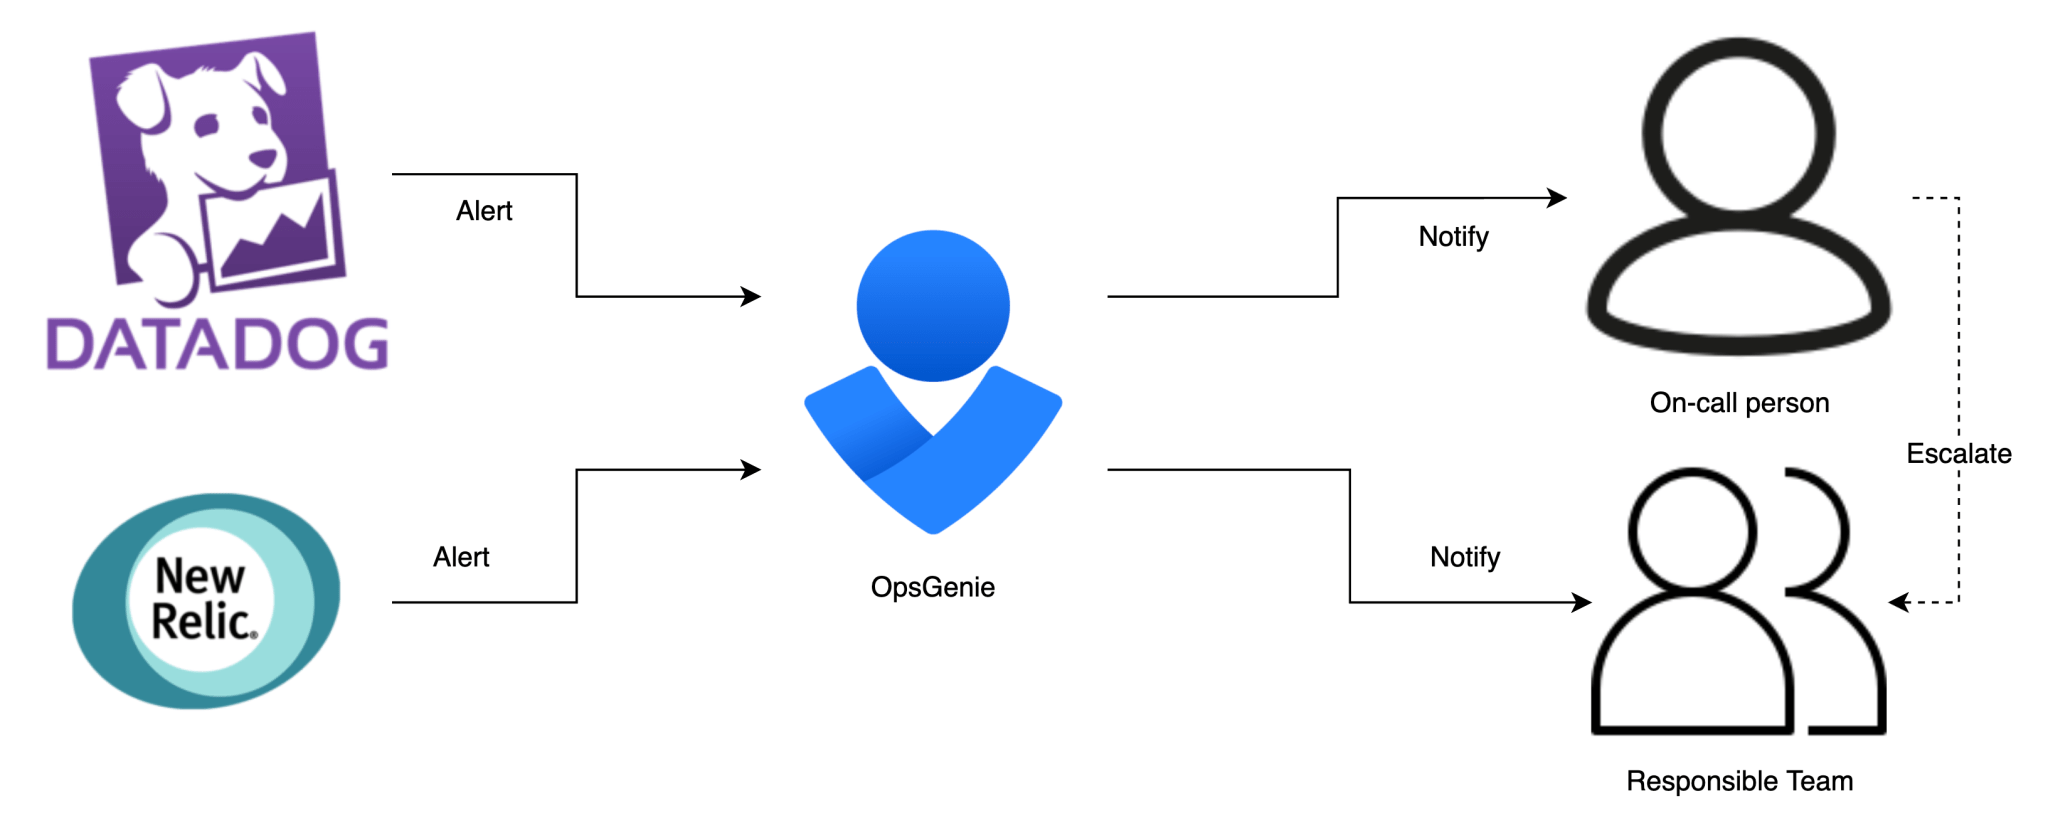
- Datadog to monitor all components created within our stack and to centralize logging of all components. You can read more about monitoring your stack with Datadog in our blog post here.
- NewRelic for APM monitoring of the Java process (Jira, Confluence, Bitbucket) within the container.
If our monitoring detects an anomaly, it creates an alert within OpsGenie. OpsGenie will make sure that this alert is sent to the team or the on-call person that is responsible to fix the problem. If the on-call person does not acknowledge the alert in time, the alert will be escalated to the team that’s responsible for that specific alert.
Conclusion
In short, we are very happy we migrated to this new stack. Combining the benefits of Kubernetes and the Atlassian Data Center versions of Jira, Confluence and BitBucket feels like a big step in the right direction. The improvements in self-healing, deploying and monitoring benefits us every day and maintenance has become a lot easier.
Interested in your own Atlassian Stack? Do you also want to leverage the power of Kubernetes? You can find more information about how we can help you on our website!