.svg?width=174&auto=compress,webp&upscale=true)
.svg?width=139&auto=compress,webp&upscale=true)

1 FEB 2021
Reading time 5 min
Stijn Schutyser

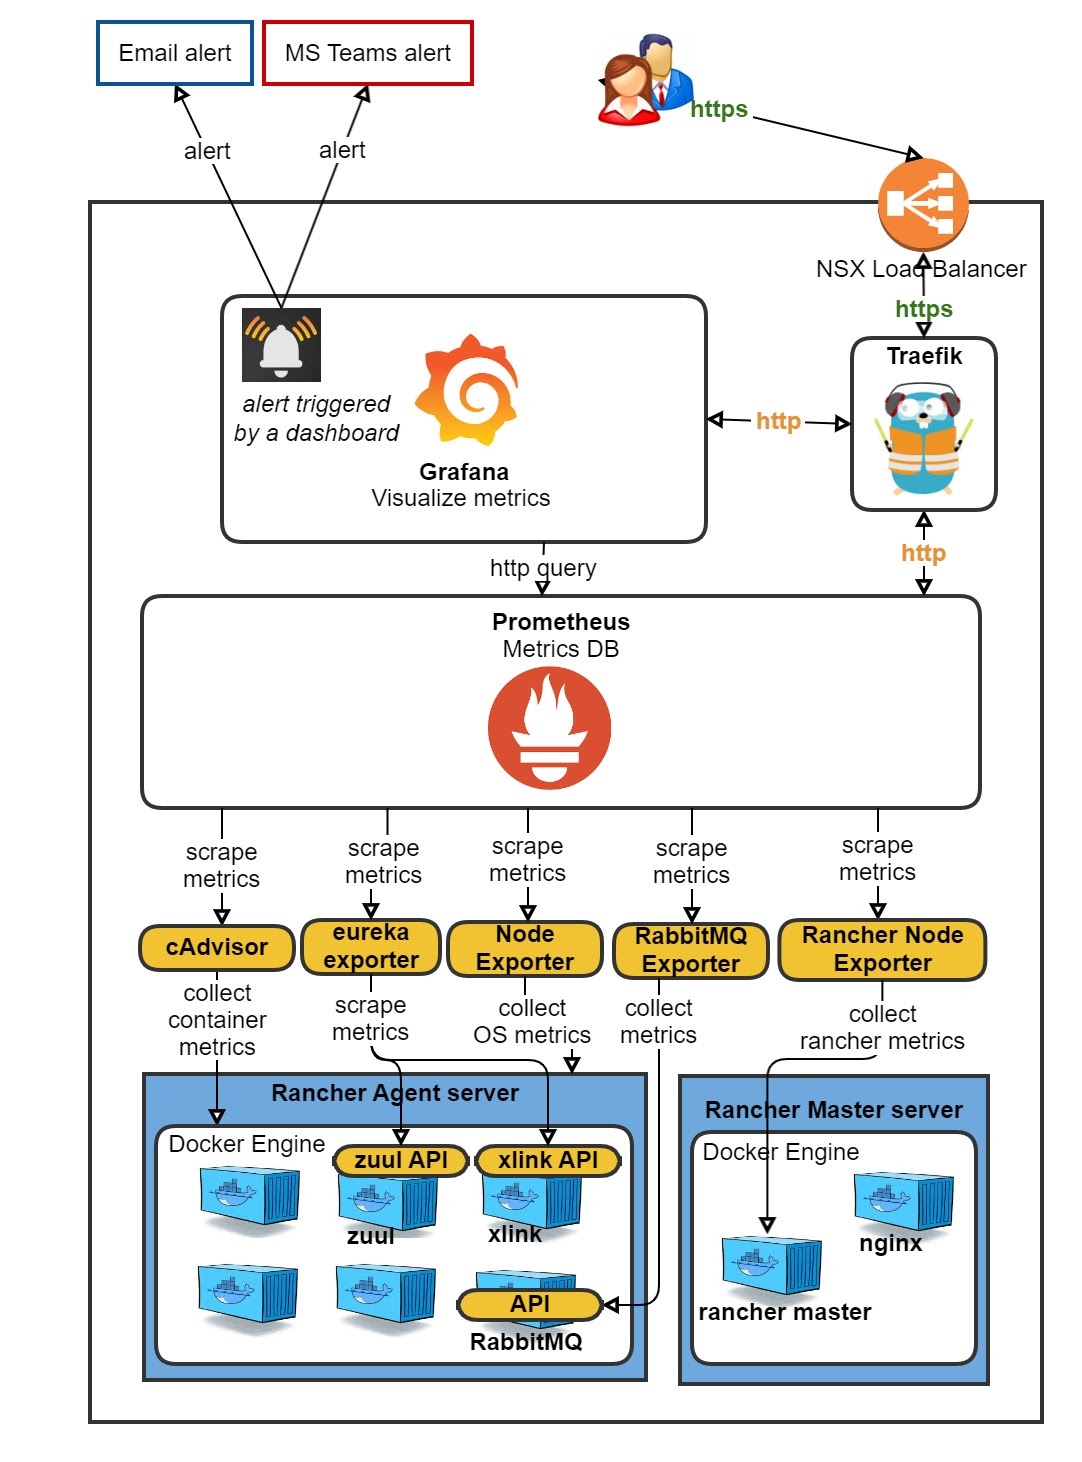
The problem with that is that this is all rather ‘standard’. When you already have a fully customized Prometheus/Grafana setup in Rancher 1, such as we do, it seems a waste to throw this out the window. The journey from a Rancher 1 ‘cattle’ Prometheus/Grafana to Rancher 2 K8s went very smooth and was fairly easy.
However, with Prometheus, you historically would have to edit the prometheus.yaml file every time you want to scrape a new application, unless you had already added your own custom discovery tool as a scrape.
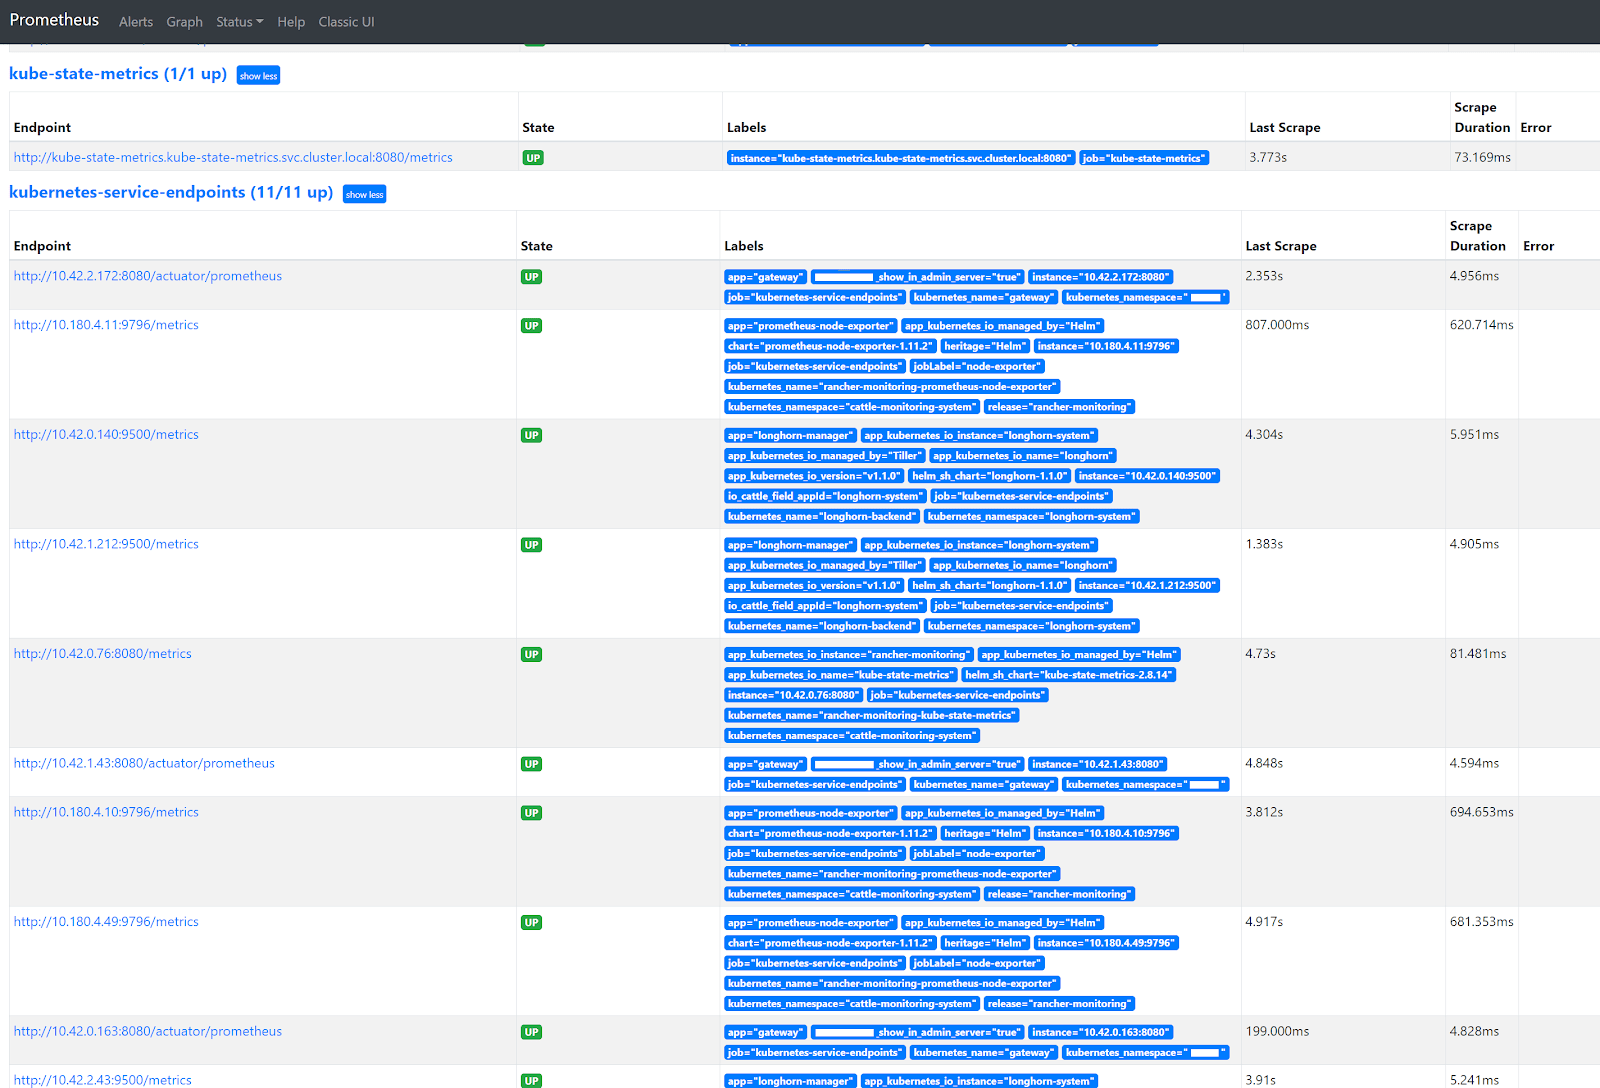
A problem that I faced with directly scraping a Longhorn and Spring Boot (or any other) Service in K8s, is that only one of the many backend pods behind that Service is scraped. So, you end up with incomplete data in Prometheus and hence incomplete data in your dashboards in Grafana. In Prometheus, you can see that only one of three existing Longhorn endpoints is scraped.

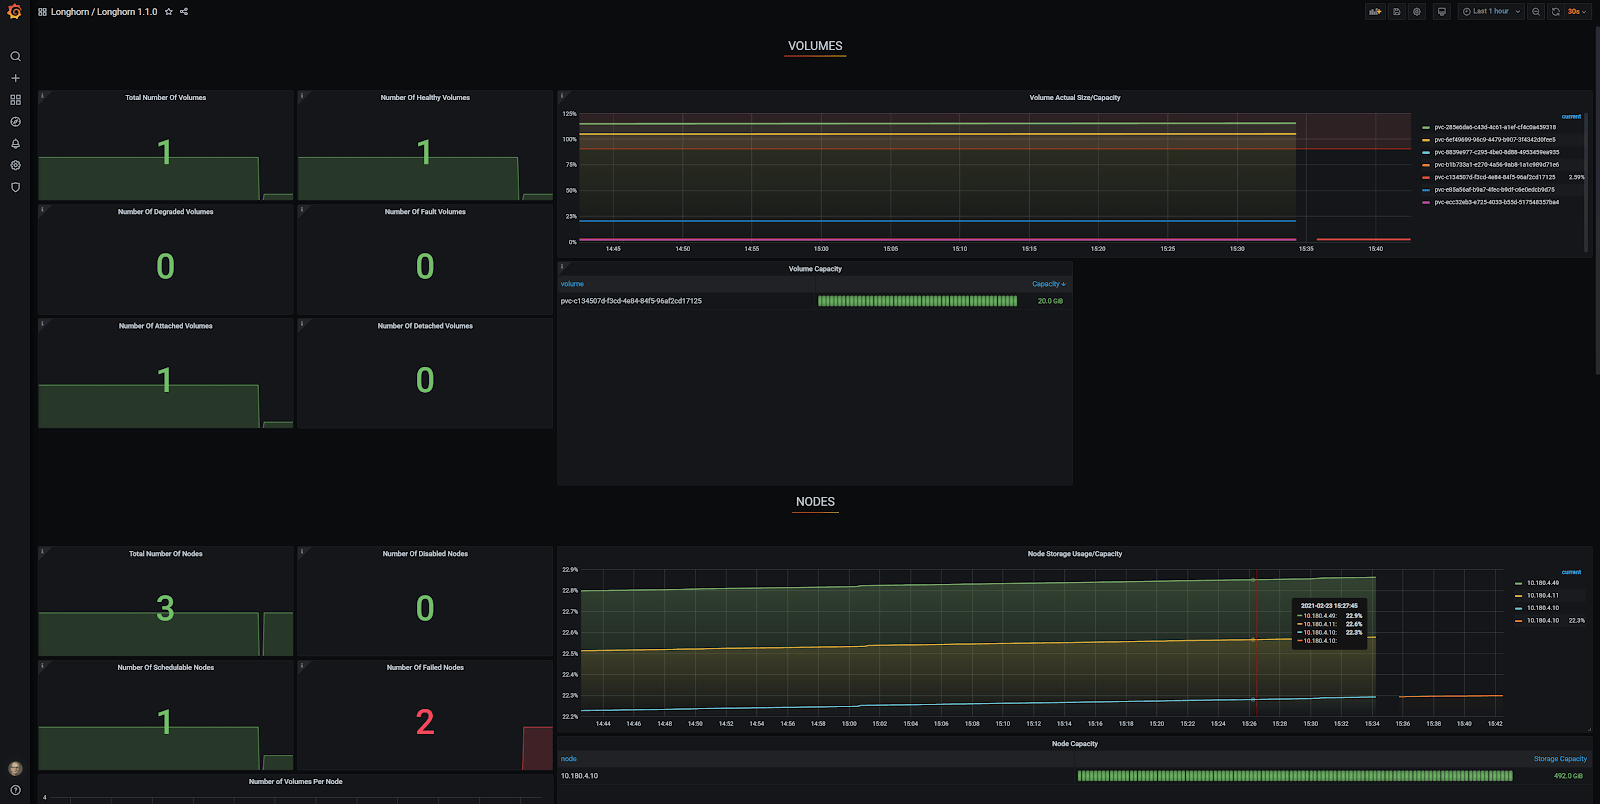
In Grafana, you can see that there is only one node accounted for and the other two are reported as ‘Failed Nodes’. To make matters worse, only one of seven volumes is reported at ‘Total Number of Volumes’.
This is where auto-discovery of Kubernetes endpoint services comes in as a true savior. Many web pages describe the various aspects of scraping, but I found none of them complete and others had critical errors.
In this blog post, I’ll provide you with a minimal and simple configuration to bring your Prometheus configuration with auto-discovery of Kubernetes endpoint services up to speed.
Add this to the end of the prometheus.yaml in your Prometheus configMap. The jobname is ‘kubernetes-service-endpoints’ as it seemed appropriate.
As in the comment above of the prometheus.yaml, you can configure the following annotations. The annotation prometheus.io/scrape: “true” is mandatory, if you want to scrape a particular service. All the other annotations are optional and explained here:
Let’s look at an example for a Longhorn Service first. (Longhorn is a great replicated storage solution!)
Next, let’s look at an example for a Spring Boot Application Service. Note the non-standard scrape path /actuator/prometheus.
First, change the namespace as needed. Note: possibly this clusterRole needs to be a little tighter than it currently is.
Again, change the namespace as needed.
Once more, change the namespace as needed. DO NOT change the name unless you change the ClusterRoleBinding subjects.name as well.
First, apply the ServiceAccount, ClusterRoleBinding, ClusterRole and Services to your K8s cluster. After updating the Prometheus configMap, redeploy Prometheus to make sure that the new configMap is activated/loaded.
Go to the Prometheus GUI and navigate to Status -> Targets. You’ll see that now all the pod endpoints ‘magically’ pop up at the kubernetes-services-endpoints heading. Any future prometheus.io related annotation changes in k8s Services will immediately come into effect after applying them!
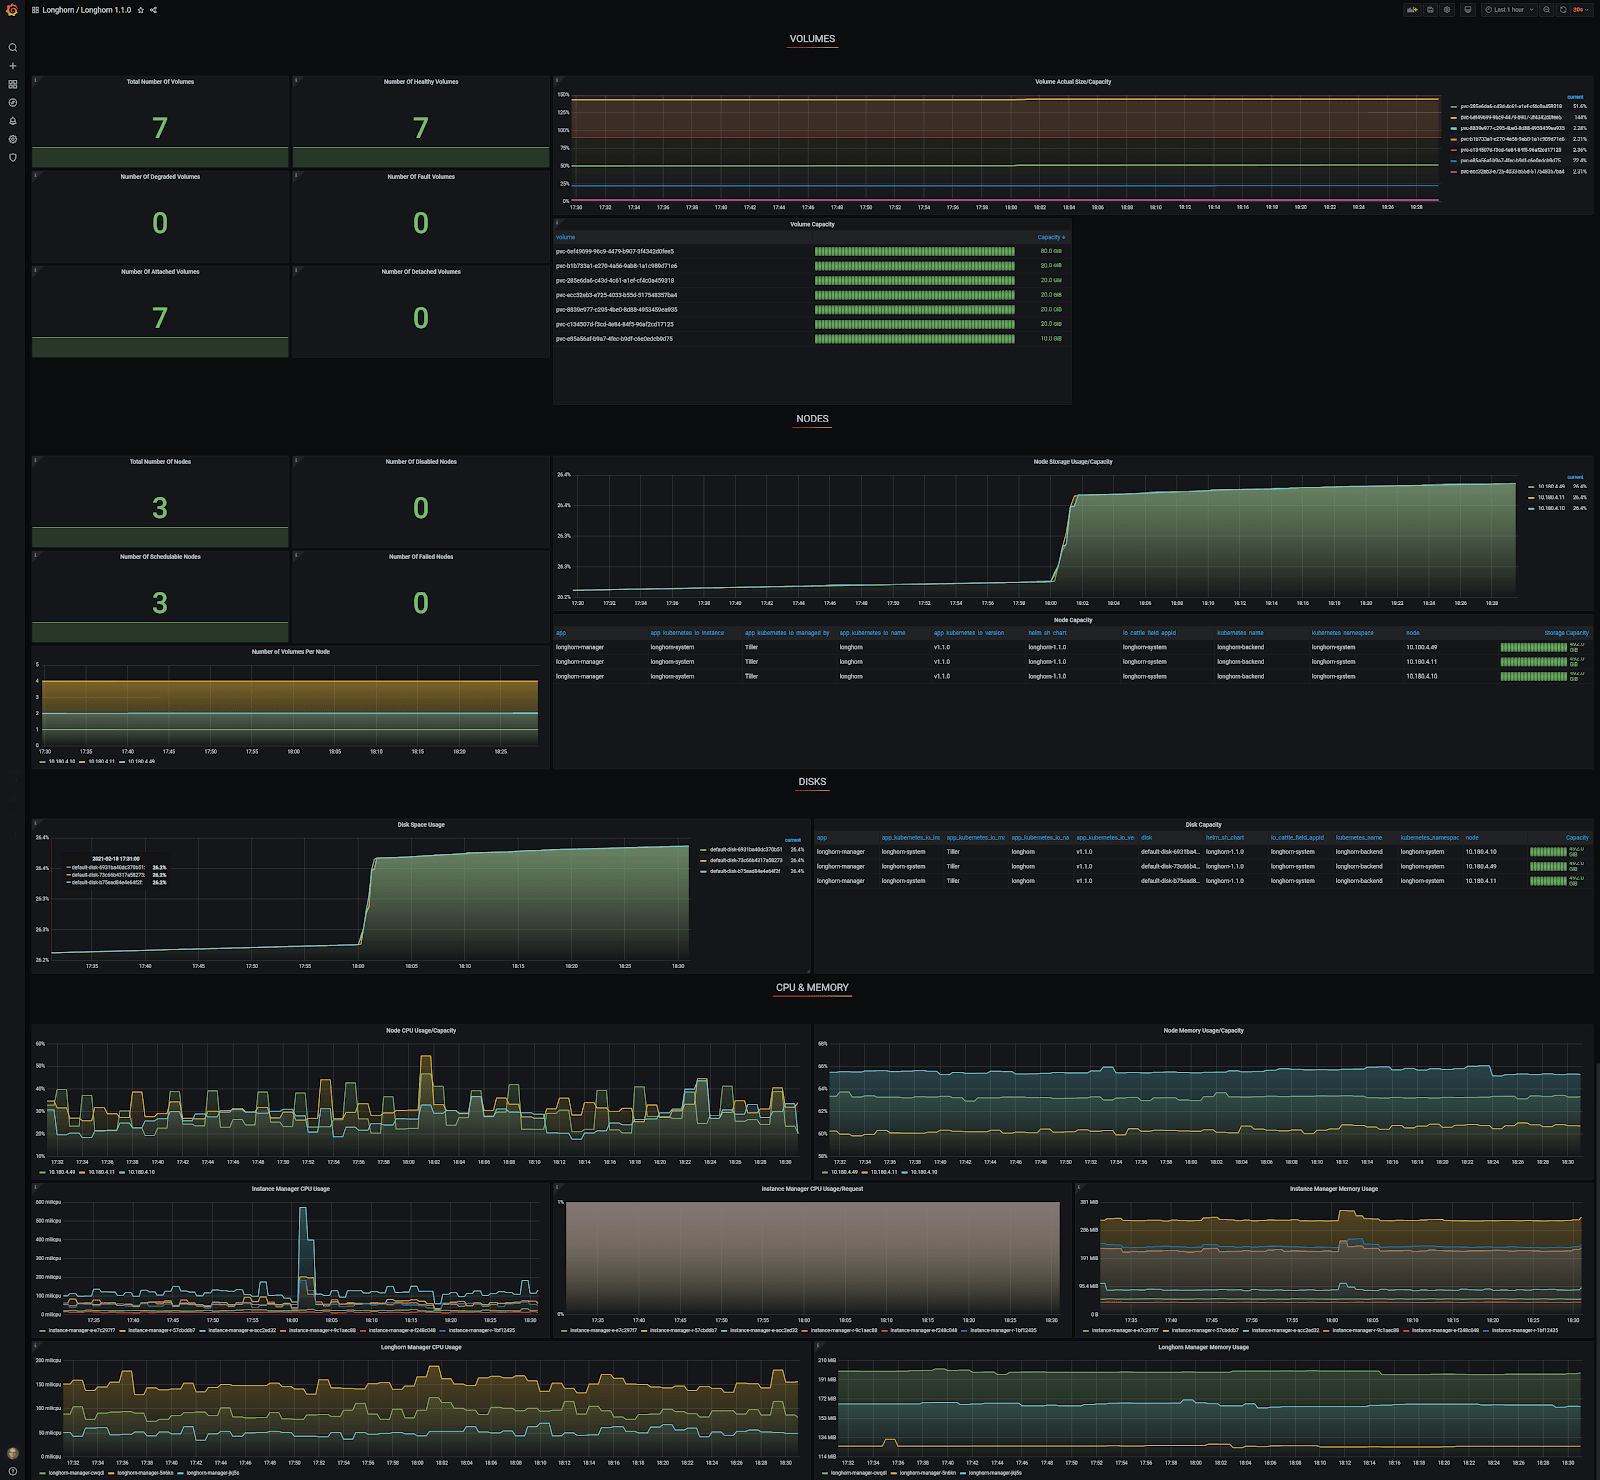
I used a generic Grafana Longhorn dashboard, which you can find here for yourself. Thanks to the auto-discovery, the Grafana Longhorn dashboard now correctly shows three nodes and seven volumes, which is exactly correct!
After running through all the steps in this blog post, you basically never have to look at your Prometheus configuration again. With auto-discovery of Kubernetes endpoint services, adding and removing Prometheus scrapes for your applications has now become almost as simple as unlocking your cell phone!
I hope this blog post has helped you out! If you have any questions, reach out to me. Or, if you’d like professional advice and services, see how we can help you out with Kubernetes.
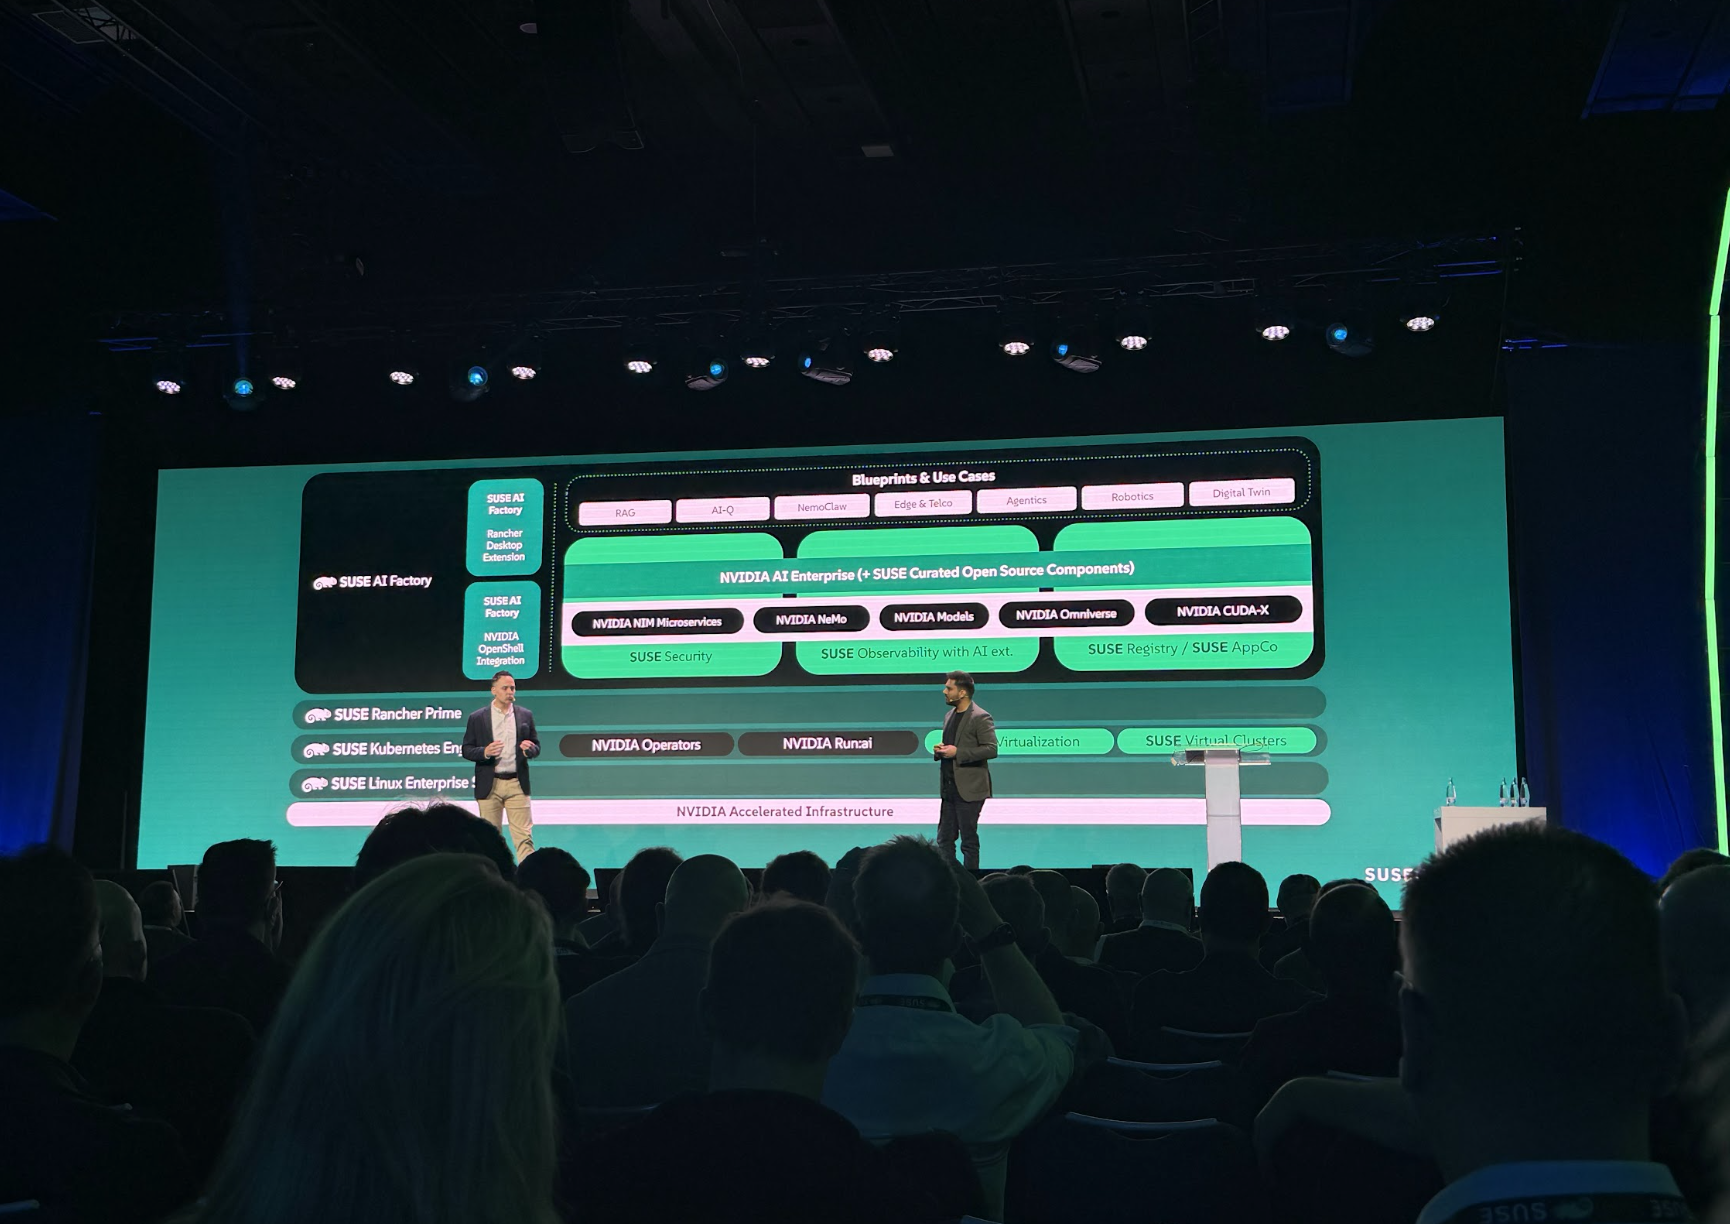
ACA Group joined over 2,000 attendees at SUSECON 2026, and one thing was clear: SUSE is accelerating its momentum in Europe, especially around digital sovereignty, AI, and edge computing.
Read more
A few years ago, AI felt like a fantastic gimmick. Last week in Amsterdam, that illusion fell apart completely. I've been part of the circus that the IT sector sometimes is for many years now. Just when you think you've seen everything, reality catch
Read more

AWS Quick is Amazon's answer to a problem nearly every business user knows: AI tools that can answer questions, but can't take action. AWS Quick is different. It's an agentic AI platform built to automate multi-step workflows across your entire tech
Read moreGet in touch with our experts today. They are happy to help!

Get in touch with our experts today. They are happy to help!
Get in touch with our experts today. They are happy to help!
Get in touch with our experts today. They are happy to help!