
How we built an intelligent stock management system
What’s the ideal store supply level for a product? How can we determine the number of future sales? Is it possible to reduce the number of product deliveries without going out-of-stock?
ACA is building an intelligent stock management system for a customer with about 30 retail locations. Between these stores, that customer sells several thousand products. Who is able to answer the questions above for all these products for every store, at all times?
Let me tell you the story of how we took a dive in historical data, combined some data science with machine learning and got some answers to the questions above.
Gathering Data
For each individual product in the catalogue, a shop manager has to determine the desired store supply. However, a human shop manager simply can’t take as many variables into account as an AI model. This results in more anticipation (a larger buffer of stock) and therefore higher costs for storage. Our goal is to help the shop manager figure out the right amount of stock with an intelligent stock management system powered by machine learning. By looking at evolution from the past, we can give an indication on how many goods will most likely be sold in the coming time period.
– Confucius

Building the model
Now that we found the necessary data, it’s time to start working on a model. Because a daily prediction was too fine grained for our client, we decided we would target a weekly prediction for a few reasons:
- while the uncertainty increases the further you look into the future, the running costs of a daily prediction are too high.
- there is not enough variation for articles that sell only 0 to 3 times a week.
- a weekly restock is ideal for most retailers and/or suppliers.
However, a weekly prediction posed an additional challenge. On average there are 52,18 weeks in a year. That means that seasonal effects might take place somewhat later each year. There are advantages, too: a weekly prediction gave us the ability to include less popular products, which are not sold on a daily basis.
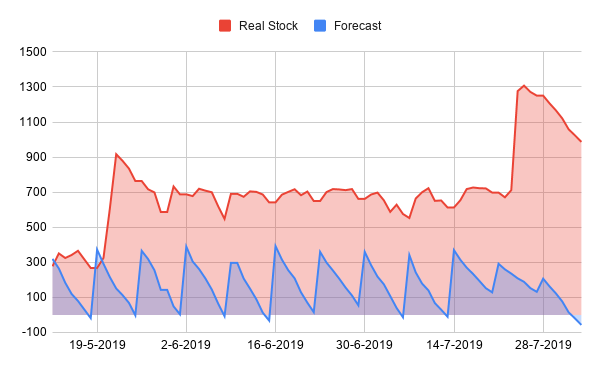
We considered a few techniques on predicting time series. Because of the limited timeframe on the data, we went for a model based on structural time series. To implement the model we selected the STS module from TensorFlow Probability. Below is the result of a prediction from our model. The red line represents the number of articles in the store for a particular product. The blue line is the weekly-based prediction of our model, reduced with daily sold items for that product. Even though at some points we’re going out-of-stock, this gives a pretty good estimate of how much supplies the store needs in the coming week.
Putting it all together
It’s difficult to put an exact value on the cost of oversupply. By looking at the total articles stored per week, we gathered that our model would reduce the inventory carrying cost by almost 75%. Clearly, empty shelves in a store are not appealing from a customer’s point of view. But this information gives our client the opportunity to reduce the size and frequency of deliveries to an optimal point.
In addition to the fact that the model gives a good prediction, we can get information on how much influence a feature has on the model’s prediction. A structural time series is represented as the sum of simpler components. This means we can actually see what effect the temperature has on sales. Furthermore, if we were to start a marketing campaign for this product, we can infer the causal impact. Basically, we can estimate how many products would have been sold when we didn’t have a promotion. There’s often a big challenge in explaining how a machine learning model exactly produces its target. With structural time series, we are able to point out which features have the biggest influence on the prediction.
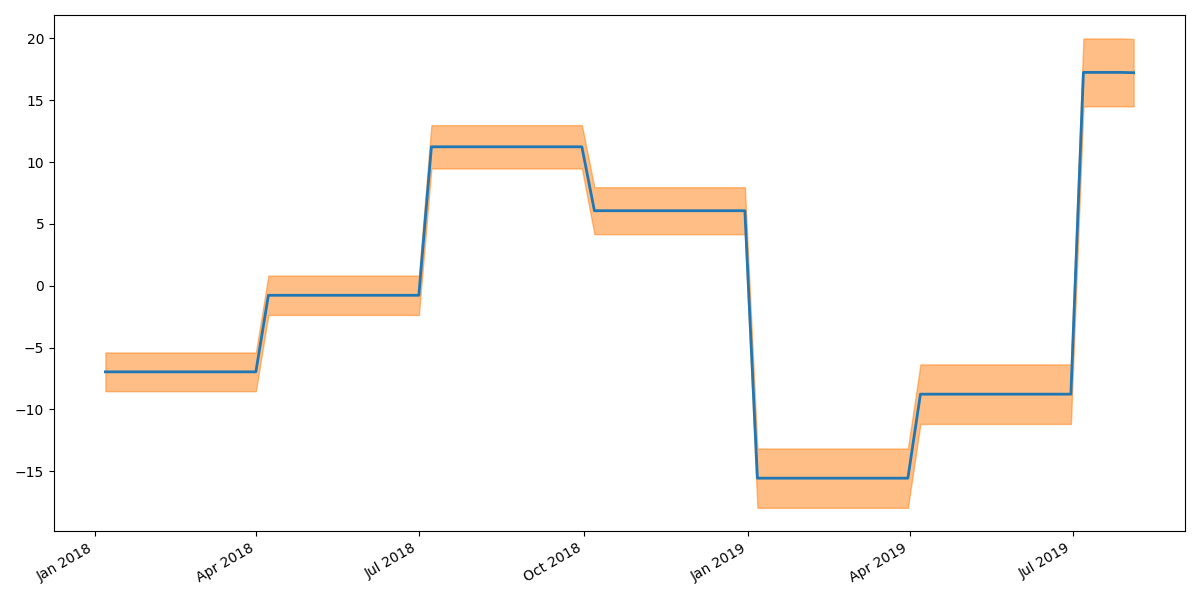
The graph above shows the influence of a season (13 weeks) on product sales. Even in this short time period, there’s a clear increase in sales in July.
 Takeaway
There’s no easy way to predict the future. But by looking back in time, we can discover patterns which we can project forward. We used this technique to give one of our clients an idea of how much sales they might generate in the coming week(s). Going further, we can assume our model becomes more and more reliable as the historical data grows.
I started this blog post with asking who would be able to determine the store supply of thousands of products in multiple stores. With a little nudge in the right direction from an intelligent stock management system, anybody can be that person.