Personalized data cards with self-defined regions in Power BI for Group A

Group A is the umbrella organization for Kwadro and Belisol. They are active in Belgium, the Netherlands and France and specialize in exterior joinery in aluminium, PVC, wood and in the installation of windows and shutters. Belisol has grown into the largest supplier of doors and windows in Belgium and the Netherlands.
The challenge: clearly map all their branches
To visualize certain KPIs and other important data, group A wanted to use a map of self-defined regions with their branches on it. Group A calls these 'branch groups'. These regions or branch groups are based on the geographic locations of their showrooms. But because it was only possible to visualize official Belgian or Flemish municipal boundaries, they needed support to report their figures in the desired way.
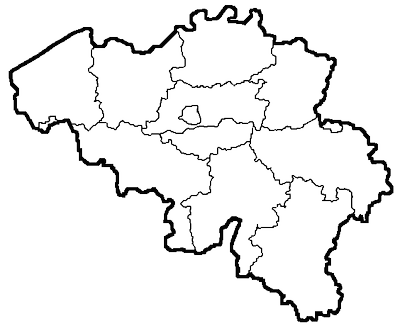
Everyone knows the map of Belgium below, which can be subdivided into regions, provinces, districts and municipalities:
Group A asked us to personalize this map and distribute it in the above-mentioned branch groups. These groups usually consist of a combination of different municipalities in which one or more showrooms are located. In this way they can also go beyond provincial borders, so that you get a new layout of the known map.
The reason for dividing this map into branch groups is so that its reporting can be used by their employees in their day-to-day operations: displaying different types of figures per branch group, the number of online leads or calling new customers and view certain sales figures.
Our solution: clear dashboard in Power BI
Within Group A, Microsoft Power BI was already being used. Power BI is an integrated, easy-to-use and easily scalable platform for self-service BI. Through connections between your data and using visualizations you get deeper insights into your data. Using the platform, you can build impressive data experiences that give you insights to make better decisions.
Get started yourself thanks to self-service BI
With self-service BI, employees who have little affinity with data or have less technical knowledge can get started with certain data themselves and easily set up and consult dashboards.
Together with Group A, we started collecting data that they already had available, such as a mapping of which municipality belongs to which branch group. We then looked for a map of Belgium in TopoJSON format, a specific file format that encodes topology.
Because the branch groups were already defined per zip code, we selected a map with a subdivision per municipality and with zip code as one of the attributes. Since only maps with NIS code were available as an attribute, we created a map layer ourselves and added zip code as an attribute based on the most recent conversion table from StatBel.
Once this map layer was created, we added the branch group data as an attribute based on zip code. Once this was added, we were able to rearrange the map based on branch group. Creating map layers, adding attributes and rearranging map layers was always done using the free Mapshaper tool.
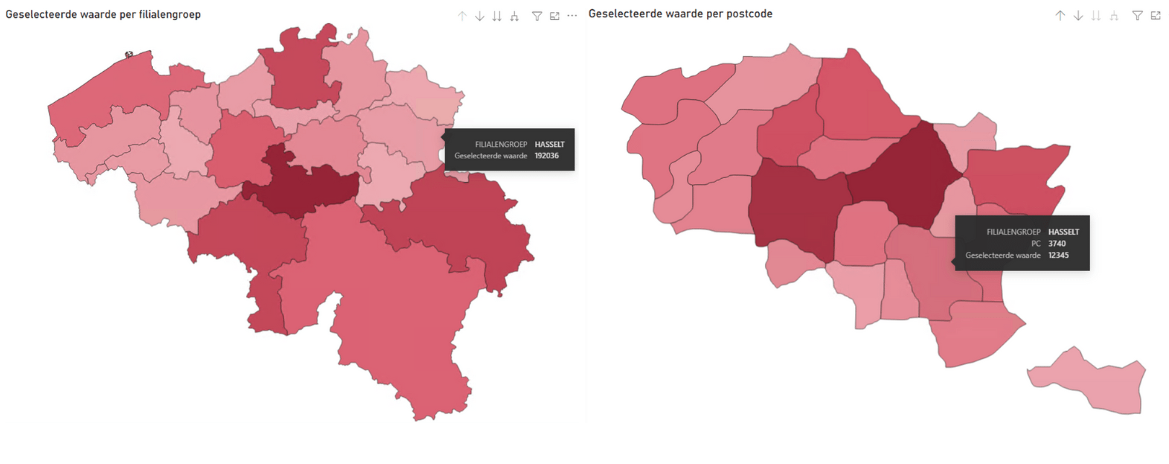
Easily consult desired data per branch group
Afterwards, we further elaborated the different map layers in Power BI. There are many visuals available that allow you to combine multiple map layers. This way, we have created a map visual that can show desired values per branch group and where it is possible to drill-down to the underlying municipalities per branch group. This makes it possible for Group A to show, for example, a turnover figure per branch group on the map. When a certain branch group is clicked, this turnover figure is shown per municipality that is located in the selected branch group.
I came to ACA with a pretty specific question: I wanted to provide insight into certain figures on a map, with a selective representation of our own sales regions and a subdivision within those regions.
The ACA data team managed to get this done in no time. The communication was excellent and they strived to deliver exactly what I had in mind. This attitude led to the desired result!
— Patricia Alen, Marketing Director at Group A


Questions or want more info about this customer success story?
Stijn is happy to help!


Related customer success stories
- How Livlina uses data to optimize their customer service
Read more on how we helped Livlina to use data to optimize their customer service!
- Transforming sustainable mobility: our collaboration with MobilityPlus
Read more about the project(s) we realized with and for MobilityPlus.
- Innovative data dashboard for amfori’s sustainability platform
For amfori's sustainability platform, we created a completely new and user-friendly insights dashboard.