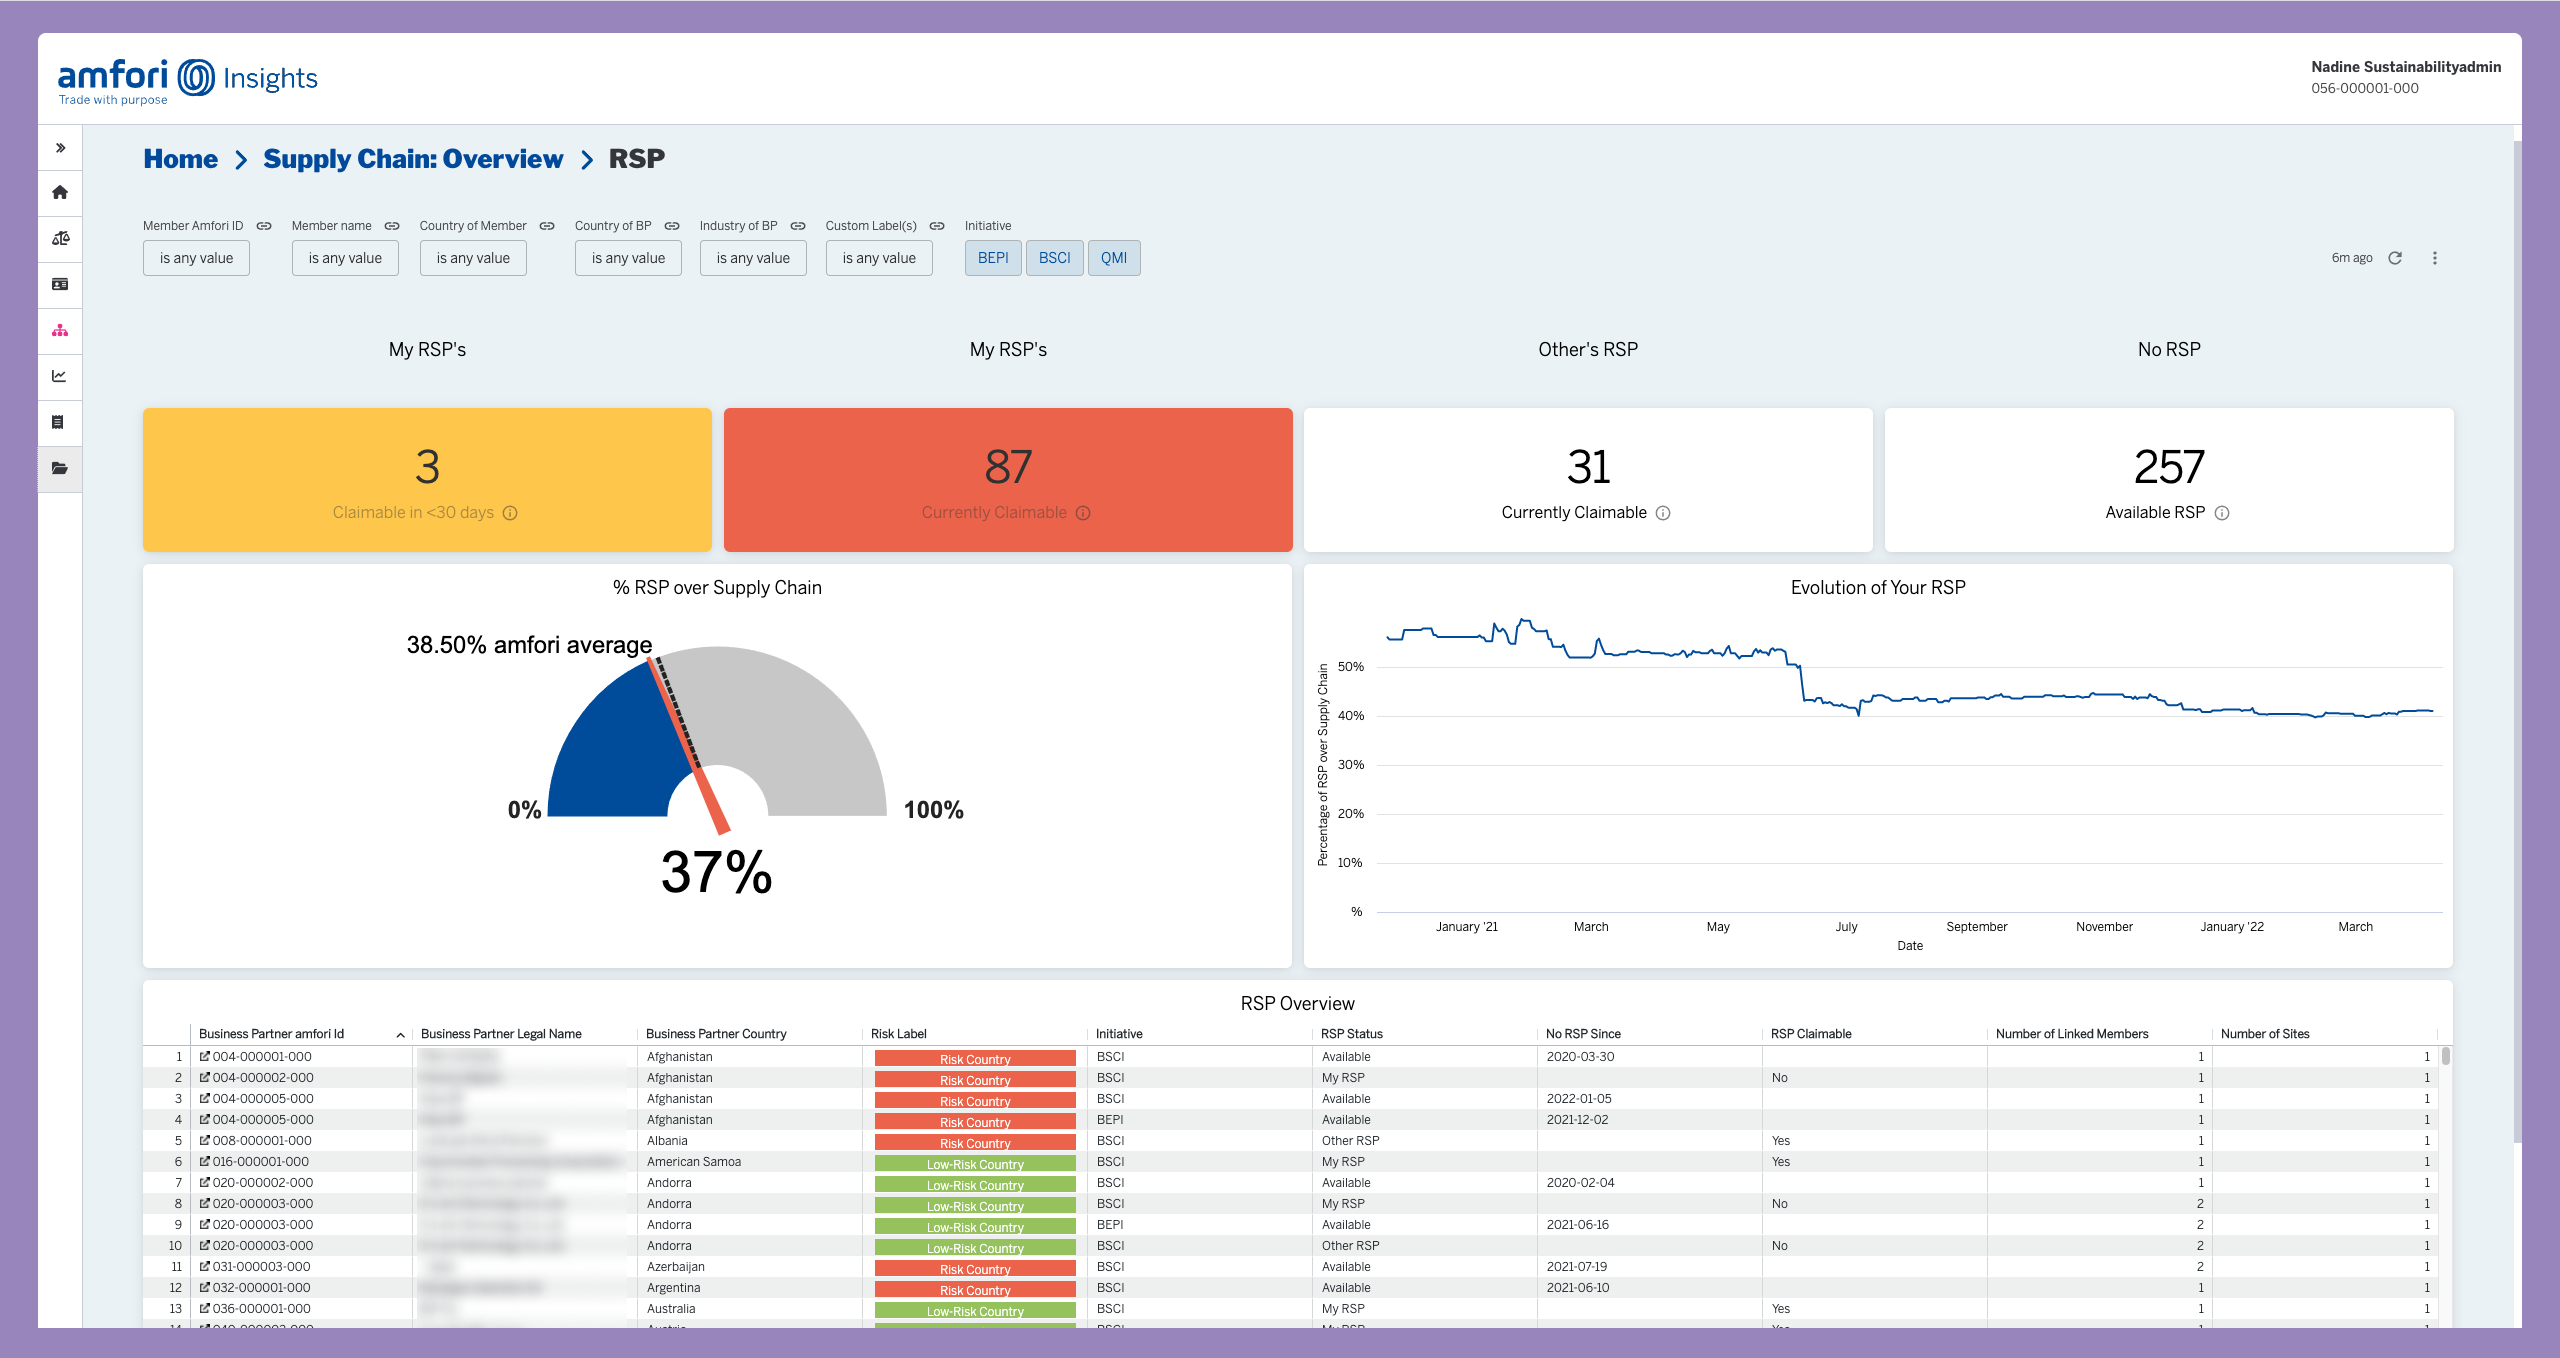
Innovative data dashboard for amfori’s sustainability platform
- A completely new and user-friendly insights dashboard
- Own management thanks to self-service BI
- Constantly adding more internal & external data
![]()
amfori is a leading global organization committed to open and sustainable trade. They bring together more than 2400 retailers, importers, brands and associations from more than 40 countries. amfori helps its members by driving environmental, social and trade improvements in their supply chains.
amfori’s sustainability platform
Our development team has been working for amfori for some time now. They created the Sustainability Platform that went live in 2020. This platform offers companies a user-friendly and practical way to consult the sustainability performance of supply chains. In addition, users can request audits via the platform and view the results.
A crucial part of this platform is, of course, data. Without the right data in the right place, companies are unable to gain insight into their supply chains and consult clear dashboards about this. For all things concerning data, amfori initially enlisted the help of another third party, that set up a page where members can access reports on their entire supply chains.
The challenge: flexibility in using dashboards
Unfortunately, amfori was not 100% satisfied with this insights page and the data dashboards it contained. A first issue was that amfori did not manage this insights page themselves, and could therefore not make adjustments or consult specific overviews.
For example, when one of the members requested a specific report from a specific country or business partner, amfori always had to rely on the external party. In other words: amfori was not in control of the data and dashboards, but had to hand over the management and complete data to the external party. This led to inefficiency in communication and, ultimately, loss of time.
A second issue was that the dashboards were very static and contained only basic data. This means that a deeper analysis of data was not possible. However: knowledge is power, and amfori needed a more accurate and extensive dashboard.
Our solution: a clear dashboard with own management
Because we had previously worked very closely with amfori for the development of the Sustainability Platform, we knew the business context of amfori and the platform itself in great detail.
In the first phase, our data expert met with amfori to see which data, dashboards and information are already available in the insights page. Then we started developing our own insights application that offers different dashboards depending on the business model.
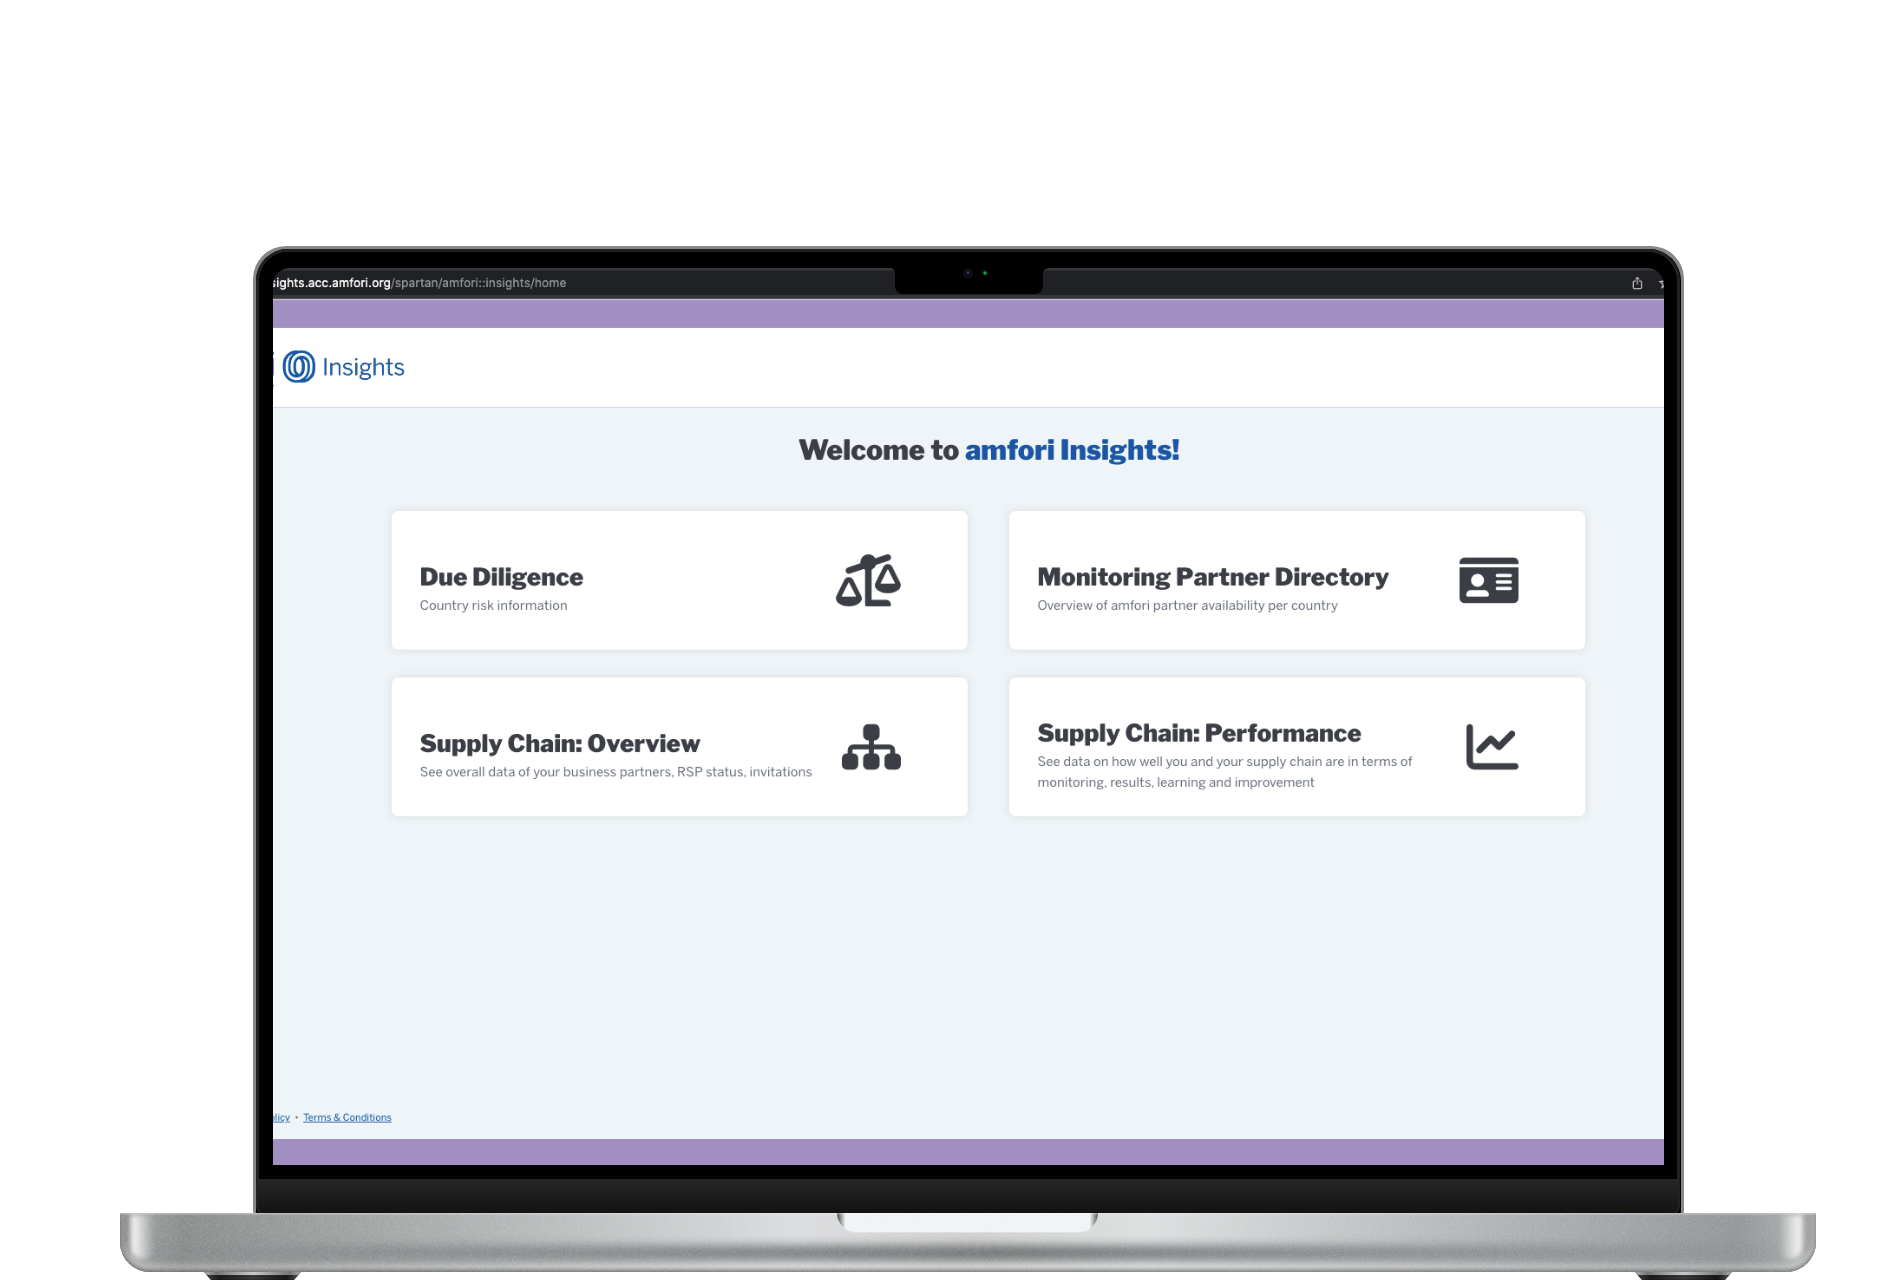
A new dashboard with enriched data
We developed a completely new insights application for amfori. This new data architecture was built entirely on the Google Cloud Platform (GCP) with BigQuery as the data warehouse. After all, the GCP offers many capabilities, both for ACA on the development side and for amfori as the customer. Thanks to its enormous computing power, the GCP works very smoothly, even when lots of data has to be processed. Additionally, GCP is extremely cost-effective to use despite its power.
To make the data available to the end users, we used GoogleLooker as a visualization tool. This tool ensures that we can improve the user experience for its users. Thanks to a Looker extension, users do not see separate dashboards, but all reports are integrated within the existing application.Because it is possible to have this application run on Looker from the backend, this simplifies the setup and maintenance of the application and is done automatically
We initially started by pulling in the data from the Sustainability Platform itself and displaying it in the new dashboard. The project is constantly evolving and the underlying architecture also supports this. After all, new external data sources are constantly being added to the application. This means that we can continue to expand the data we offer and let the dashboards grow with amfori.
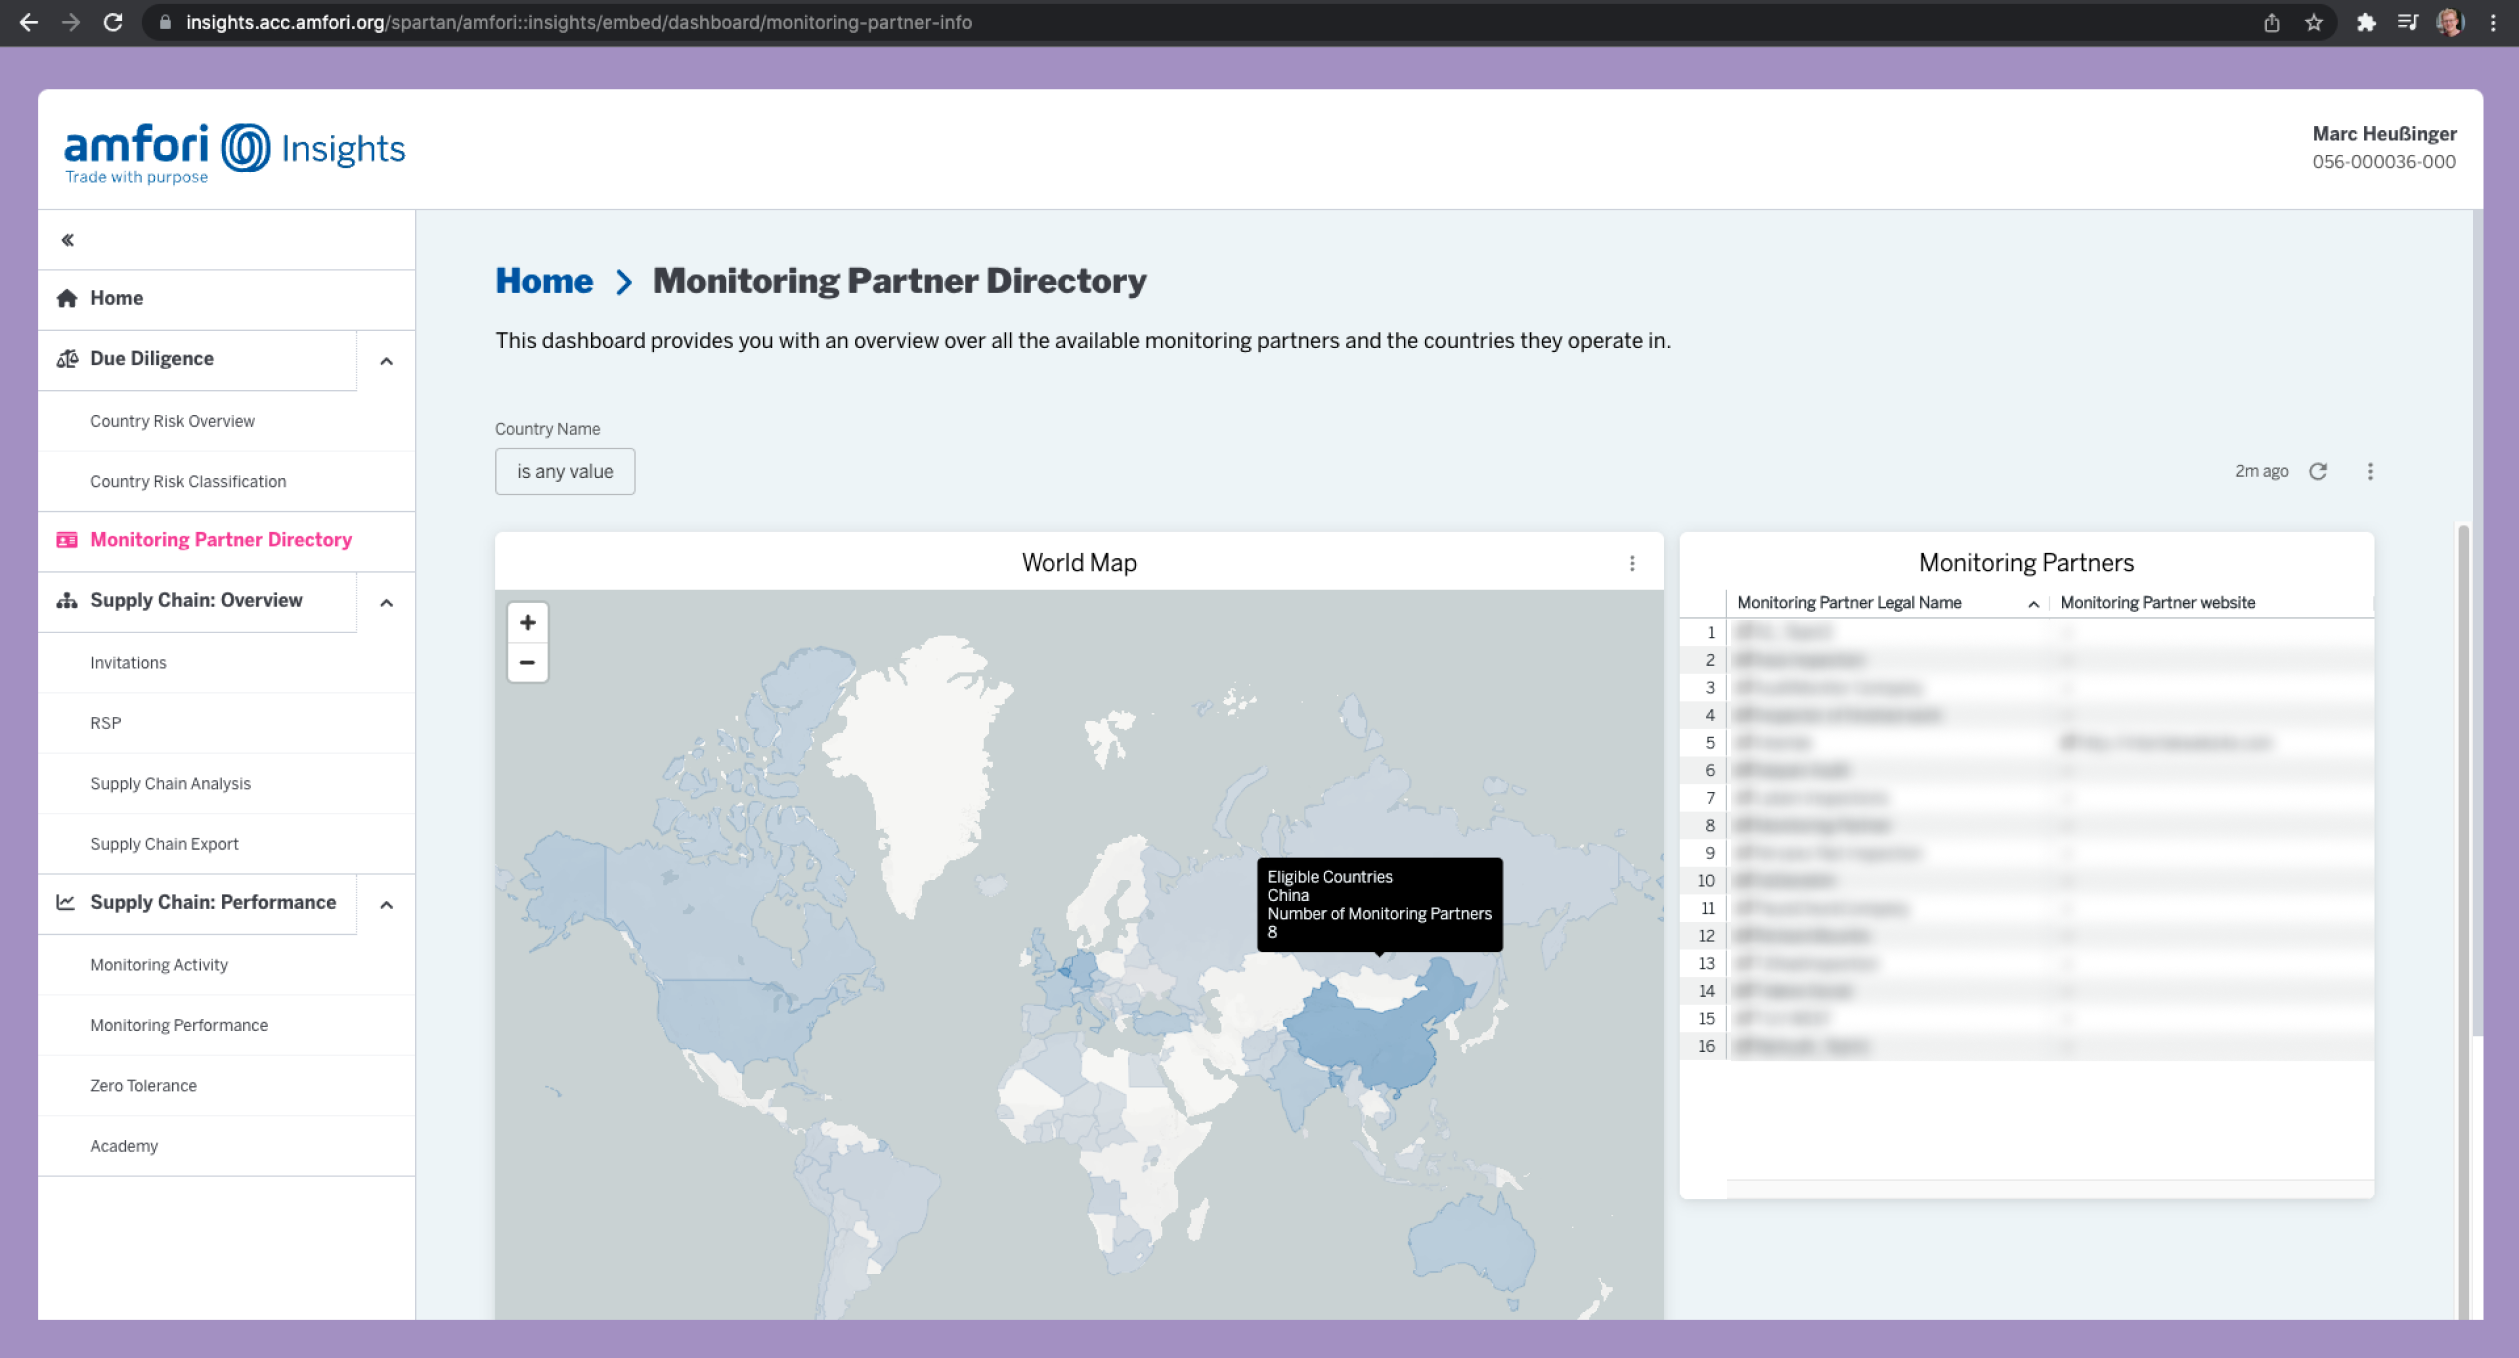
Our new insights application offers members of amfori insights into their own supply chain as well as that of all their business partners.
Own management thanks to self-service BI
Thanks to the self-service possibilities of our solution, internal users of amfori are able to quickly and easily answer ad-hoc business questions from members by using a drag-and-drop method. For example, a ‘country representative’ member can contact amfori with specific questions about statistics in their country and they can be answered quickly and efficiently. In addition, amfori has set up its own KPI dashboard for internal use, which provides an overview of activities that take place in the platform.
Thanks to self-service BI, employees - who have no affinity with data or don’t have technical knowledge - can get started with certain data themselves and easily set up and consult overviews.
The end result is a clear insights application with extensive reporting options, in which the management and storage of the data is entirely up to amfori itself.
What's next? 🚀
The project continues to evolve and improve, because our insights application is continuously expanded with more information and visuals. Besides that, the amount of data in our data warehouse continues to increase.
This allows amfori and us to extract more and more concepts from the Sustainability Platform and ensures that we can offer the customer more and more insights into their own data.
Our data warehouse is also expanding with other external sources, such as Country Indicators from the World Bank. By adding these external data sources, we can continue to enrich the current data and expand our insights application.
We also continue to invest in innovation. The goal is to go a lot further than just descriptive analyzes and apply more innovative techniquesin the future. Together with amfori, we want to use more advanced insights, such as benchmarking and adding AI/ML to perform predictive analyzes about, for example, the quality of a monitoring. In concrete terms, we are currently setting up a proof-of-concept to see whether we can attach a quality label to a monitoring system based on AI / ML. To be continued!
Do you have a question or need more info?
Stijn is happy to help!


Related customer success stories
- How Livlina uses data to optimize their customer service
Read more on how we helped Livlina to use data to optimize their customer service!
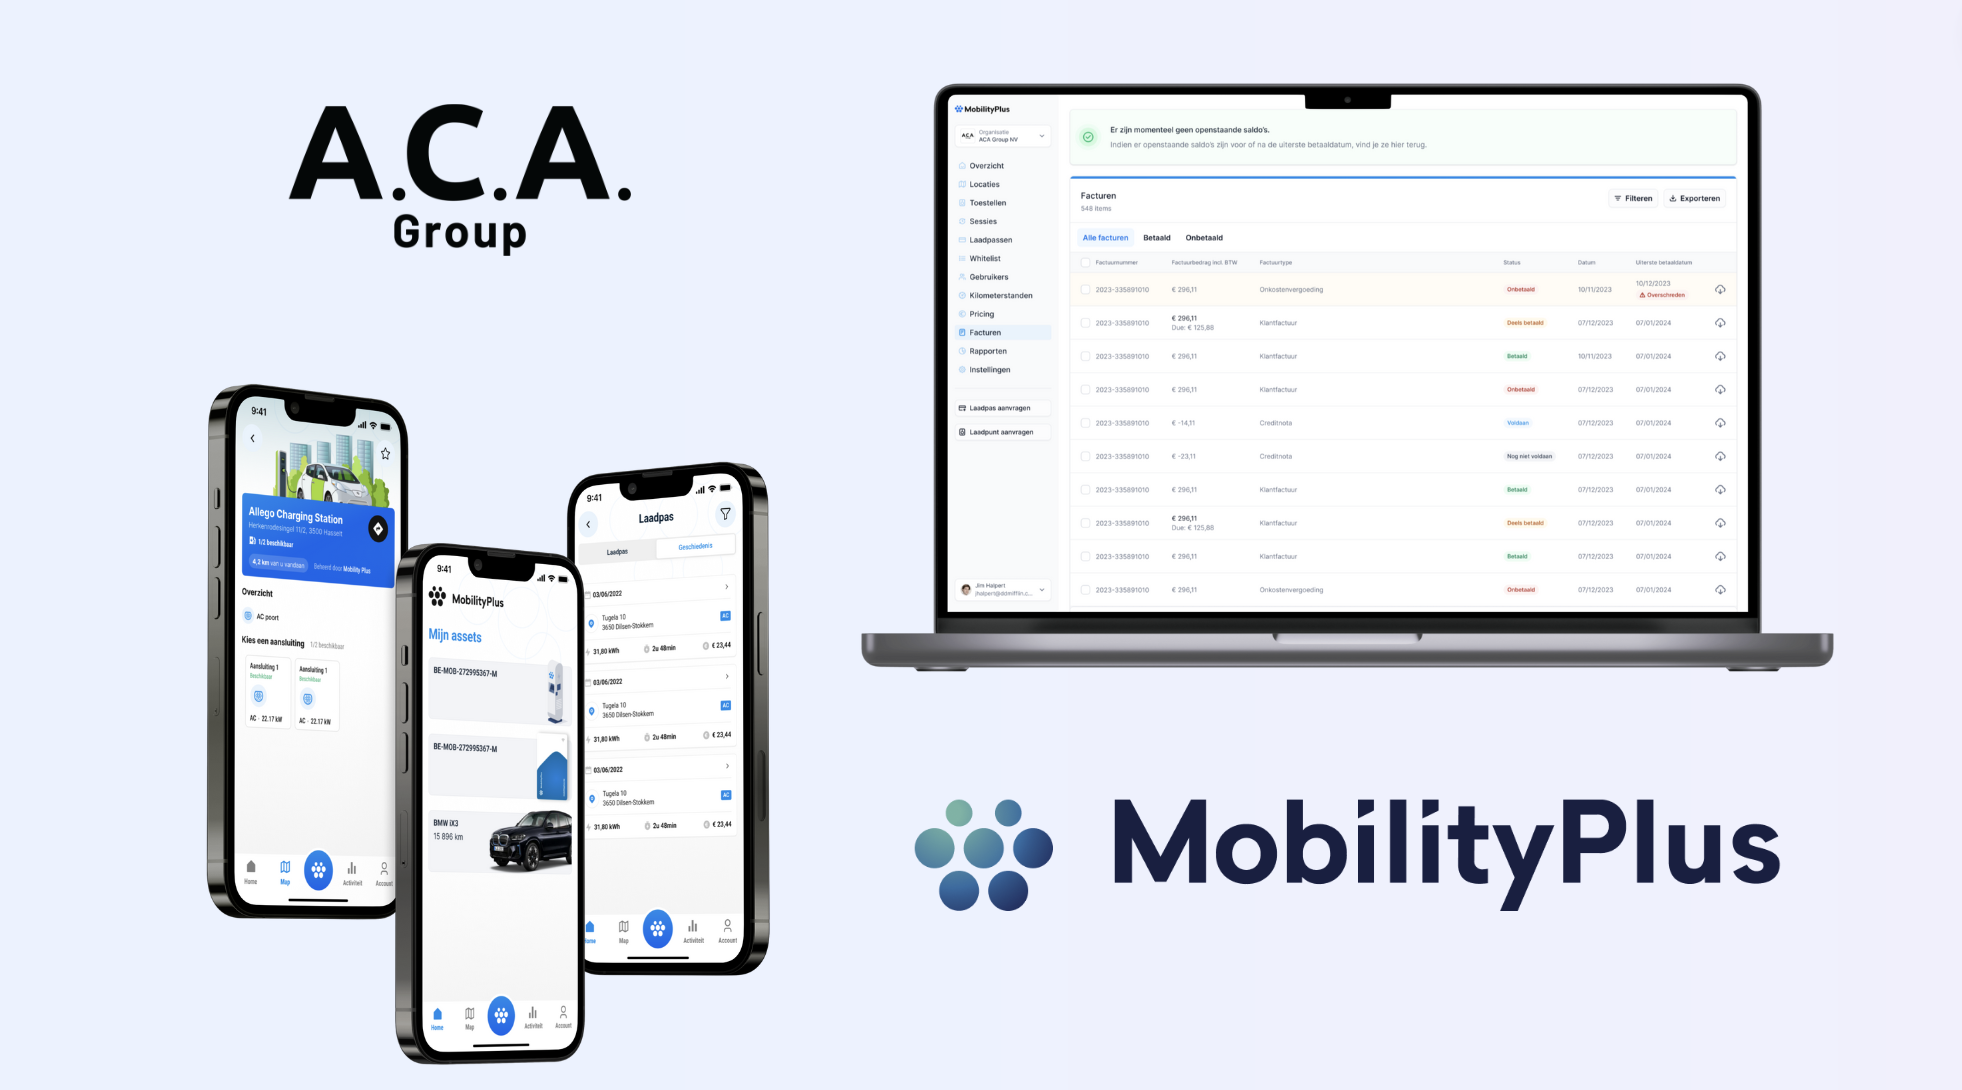
- Transforming sustainable mobility: our collaboration with MobilityPlus
Read more about the project(s) we realized with and for MobilityPlus.
- Personalized data cards in Power BI for Group A
For Group A we provided personalized data cards in Power BI.